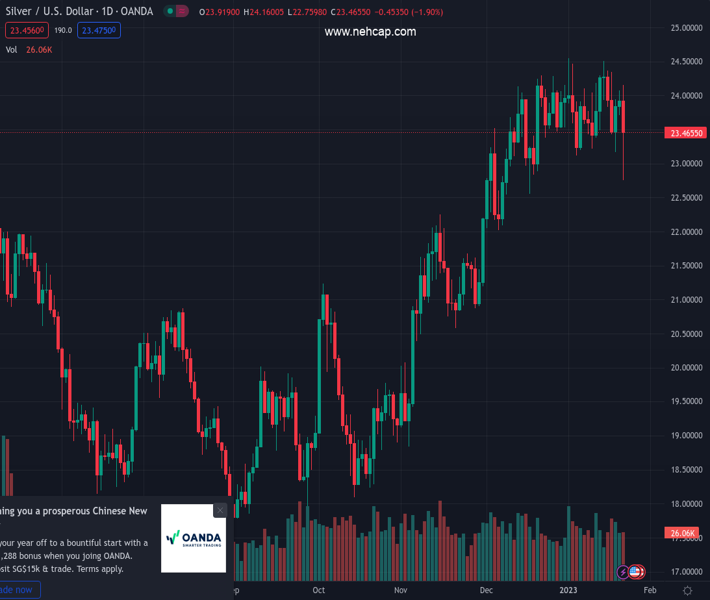
#XAGUSD @ 23.460 Silver prices dived more than 2% on Monday as US Treasury yields gained traction. (Pivot Orderbook analysis)
…
This is a premium post.
[s2If !current_user_can(access_s2member_level4)]Please register for PREMIUM VERSION HERE to read full post below containing analysis. In case of any error or you think you are not able to read the full post below, please email us at support#nehcap.com [lwa][/s2If] [s2If current_user_can(access_s2member_level4)]
- Silver prices dived more than 2% on Monday as US Treasury yields gained traction.
- Silver Price Analysis: In consolidation, though appears to be peaking around $24.00.
The pair currently trades last at 23.460.
The previous day high was 24.08 while the previous day low was 23.71. The daily 38.2% Fib levels comes at 23.94, expected to provide resistance. Similarly, the daily 61.8% fib level is at 23.85, expected to provide resistance.
Silver prices appear to have peaked following Monday’s price action, with the white metal unable to hold to the $24.00 figure, collapsing as low as $22.76, beneath the 50-day Exponential Moving Average (EMA) at $22.93, though trimmed some of its earlier losses. Nevertheless, the XAG/USD is still down 2%, exchanging hands at $23.44.
XAG/USD prices, throughout Monday’s session, have been trading in a wide range but reclaimed a 22-day upslope support trendline that passes around $23.30. Although it erased some of its earlier losses, the XAG/USD has fallen short of reclaiming the 20-day Exponential Moving Average (EMA) at $23.67. Therefore, Silver would consolidate around the $23.30-$24.00 area unless it cracks the top/bottom of the range.a breach of the day’s high of $24.15 would put into play the YTD high of $24.54 and the psychological $25.00 mark.
As an alternative scenario, the XAG/USD first support would be $23.00. Once cleared, the XAG/USD next support would be the 50-day EMA at $22.93, followed by the 100-day EMA at $22.05.
Oscillator-wise, the Relative Strength Index (RSI) crossed below its 50-midline, so further downside is expected, while the Rate of Change (RoC) suggests that buyers stepped in around Wall Street’s close.
Therefore, the XAG/USD remains neutral biased in the near term.
Technical Levels: Supports and Resistances
XAGUSD currently trading at 23.45 at the time of writing. Pair opened at 23.94 and is trading with a change of -2.05 % .
| Overview | Overview.1 | |
|---|---|---|
| 0 | Today last price | 23.45 |
| 1 | Today Daily Change | -0.49 |
| 2 | Today Daily Change % | -2.05 |
| 3 | Today daily open | 23.94 |
The pair is trading below its 20 Daily moving average @ 23.8, above its 50 Daily moving average @ 22.98 , above its 100 Daily moving average @ 21.23 and above its 200 Daily moving average @ 21.04
| Trends | Trends.1 | |
|---|---|---|
| 0 | Daily SMA20 | 23.80 |
| 1 | Daily SMA50 | 22.98 |
| 2 | Daily SMA100 | 21.23 |
| 3 | Daily SMA200 | 21.04 |
The previous day high was 24.08 while the previous day low was 23.71. The daily 38.2% Fib levels comes at 23.94, expected to provide resistance. Similarly, the daily 61.8% fib level is at 23.85, expected to provide resistance.
Note the levels of interest below:
- Pivot support is noted at 23.74, 23.54, 23.36
- Pivot resistance is noted at 24.11, 24.28, 24.48
| Levels | Levels.1 |
|---|---|
| Previous Daily High | 24.08 |
| Previous Daily Low | 23.71 |
| Previous Weekly High | 24.51 |
| Previous Weekly Low | 23.17 |
| Previous Monthly High | 24.30 |
| Previous Monthly Low | 22.03 |
| Daily Fibonacci 38.2% | 23.94 |
| Daily Fibonacci 61.8% | 23.85 |
| Daily Pivot Point S1 | 23.74 |
| Daily Pivot Point S2 | 23.54 |
| Daily Pivot Point S3 | 23.36 |
| Daily Pivot Point R1 | 24.11 |
| Daily Pivot Point R2 | 24.28 |
| Daily Pivot Point R3 | 24.48 |
[/s2If]
Join Our Telegram Group
")


