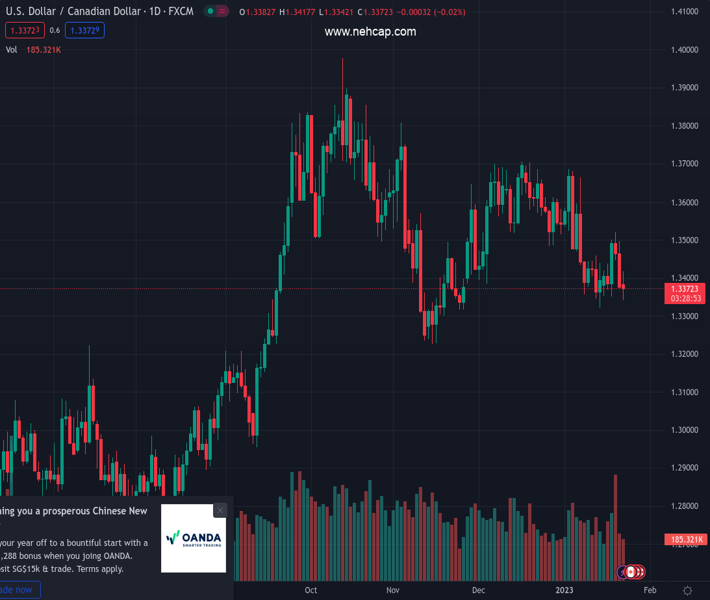
#USDCAD @ 1.33731 seesawed around 1.3342-1.3417, ahead of the Bank of Canada monetary policy decision. (Pivot Orderbook analysis)
…
This is a premium post.
[s2If !current_user_can(access_s2member_level4)]Please register for PREMIUM VERSION HERE to read full post below containing analysis. In case of any error or you think you are not able to read the full post below, please email us at support#nehcap.com [lwa][/s2If] [s2If current_user_can(access_s2member_level4)]
- USD/CAD seesawed around 1.3342-1.3417, ahead of the Bank of Canada monetary policy decision.
- Analysts expect the BoC to raise rates by 25 bps and to pause.
- The BoC would release monetary policy minutes for the first time in its history.
The pair currently trades last at 1.33731.
The previous day high was 1.3498 while the previous day low was 1.3378. The daily 38.2% Fib levels comes at 1.3423, expected to provide resistance. Similarly, the daily 61.8% fib level is at 1.3452, expected to provide resistance.
The USD/CAD erases some of its earlier losses, climbs toward the 1.3370 region after briefly touching its daily low of 1.3342, ahead of a crucial week for the Canadian Dollar (CAD), with the Bank of Canada (BoC) setting rates for the first time in 2023. In addition, a late US Dollar (USD) bid keeps the USD/CAD from breaking to test the 200-day EMA. The USD/CAD is trading at 1.3375.
Traders mood remains upbeat amid the lack of Fed speakers due to the blackout period, ahead of the first Federal Reserve (Fed) meeting in 2023. The Canadian economic docket featured housing data, with the New Housing Price Index MoM edging to 0%, above estimates for a 0.2% contraction, while YoY eased from 4.1% to 3.9%. The Conference Board (CB) Leading Index in the US dropped to -1%, beneath the -0.7% estimates.
“The US LEI fell sharply again in December – continuing to signal recession for the US economy in the near term,” Ataman Ozyildirim, the Conference Board’s senior director for economics, said in a statement.
Aside from this, the BoC monetary policy decision on Wednesday could keep the USD/CAD pair subdued. Analysts expect a 25 bps rate hike, to 4.50%, with a good portion of them estimating that the BoC would pause.
TD Securities Analysts estimate the BoC would hike rates by 25 bps, adding, “We expect this to be the final move in the BoC’s tightening cycle, while markets are only pricing a small probability (20%) of further hikes.” It should be said that for the first time, the Bank of Canada would release monetary policy minutes, which according to analysts, “will help restore credibility lost last year amid soaring inflation and encourage out-of-the-box thinking,” according to Reuters.
Therefore, the USD/CAD would likely remain subdued around the 1.3316-1.3424 area, which sits the 100-day Exponential Moving Average (EMA). The Relative Strength Index (RSI) is almost flat at bearish territory, suggesting that sellers remain on the sidelines, bracing for the BoC’s decision, while the Rate of Change (RoC) suggests bears are stepping in. If the USD/CAD holds below 1.3400, that would pave the way for further downside. Key support lies at 1.3300, followed by the 200-day EMA at 1.3249.
Technical Levels: Supports and Resistances
USDCAD currently trading at 1.3376 at the time of writing. Pair opened at 1.3381 and is trading with a change of -0.04 % .
| Overview | Overview.1 | |
|---|---|---|
| 0 | Today last price | 1.3376 |
| 1 | Today Daily Change | -0.0005 |
| 2 | Today Daily Change % | -0.0400 |
| 3 | Today daily open | 1.3381 |
The pair is trading below its 20 Daily moving average @ 1.3486, below its 50 Daily moving average @ 1.35 , below its 100 Daily moving average @ 1.3513 and above its 200 Daily moving average @ 1.319
| Trends | Trends.1 | |
|---|---|---|
| 0 | Daily SMA20 | 1.3486 |
| 1 | Daily SMA50 | 1.3500 |
| 2 | Daily SMA100 | 1.3513 |
| 3 | Daily SMA200 | 1.3190 |
The previous day high was 1.3498 while the previous day low was 1.3378. The daily 38.2% Fib levels comes at 1.3423, expected to provide resistance. Similarly, the daily 61.8% fib level is at 1.3452, expected to provide resistance.
Note the levels of interest below:
- Pivot support is noted at 1.334, 1.3299, 1.322
- Pivot resistance is noted at 1.346, 1.3539, 1.358
| Levels | Levels.1 |
|---|---|
| Previous Daily High | 1.3498 |
| Previous Daily Low | 1.3378 |
| Previous Weekly High | 1.3521 |
| Previous Weekly Low | 1.3351 |
| Previous Monthly High | 1.3705 |
| Previous Monthly Low | 1.3385 |
| Daily Fibonacci 38.2% | 1.3423 |
| Daily Fibonacci 61.8% | 1.3452 |
| Daily Pivot Point S1 | 1.3340 |
| Daily Pivot Point S2 | 1.3299 |
| Daily Pivot Point S3 | 1.3220 |
| Daily Pivot Point R1 | 1.3460 |
| Daily Pivot Point R2 | 1.3539 |
| Daily Pivot Point R3 | 1.3580 |
[/s2If]
Join Our Telegram Group
")


