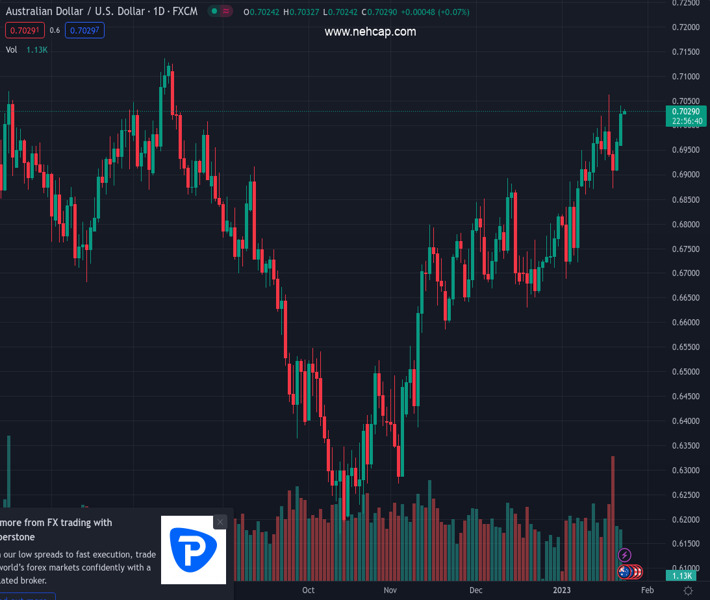
#AUDUSD @ 0.70281 bulls take a breather around five-month high, sidelined of late. (Pivot Orderbook analysis)
…
This is a premium post.
[s2If !current_user_can(access_s2member_level4)]Please register for PREMIUM VERSION HERE to read full post below containing analysis. In case of any error or you think you are not able to read the full post below, please email us at support#nehcap.com [lwa][/s2If] [s2If current_user_can(access_s2member_level4)]
- AUD/USD bulls take a breather around five-month high, sidelined of late.
- Preliminary readings of S&P Global Manufacturing and Services PMIs softened, Composite PMI improved for January.
- Receding fears of strong recession in 2023, optimism surrounding China underpin bullish bias.
- US PMIs eyed for intraday directions, US Q4 GDP are the key for fresh impulse.
The pair currently trades last at 0.70281.
The previous day high was 0.6974 while the previous day low was 0.6906. The daily 38.2% Fib levels comes at 0.6948, expected to provide support. Similarly, the daily 61.8% fib level is at 0.6932, expected to provide support.
AUD/USD justifies the recent activity data from Australia as the pair buyers take a breather around the highest levels since August, marked the last week, following the downbeat release of Aussie S&P Global PMIs for January. Also challenging the risk barometer pair could be the recently cautious mood ahead of the key US PMIs, as well as the US four-quarter (Q4) Gross Domestic Product (GDP).
Australia’s S&P Global Manufacturing PMI dropped below 50.0 for the first time since June 2020, to 49.8 versus 50.3 expected and 50.2 prior. Further, the Services PMI also suggested the activity contraction by declining below the 50.0 figure even after improving from 47.3 prior, to 48.3 versus 49.7 market forecasts. With this, the S&P Global Composite PMI rose to 48.2 compared to 47.5 prior.
Given the softer activity data from Australia, the receding odds of the Reserve Bank of Australia’s (RBA) retreat from the previously hawkish bias appear legitimate to expect, which in turn probe the AUD/USD bulls despite the broad US Dollar weakness. However, this week’s Australia Consumer Price Index (CPI) and RBA Trimmed Mean CPI for December will be crucial for the clear directions.
Other than the data at home, softer prints of the US Conference Board’s Leading Index for December, to -1.0% versus -0.7% expected and -1.1% prior, added weakness to the US Dollar and favored the AUD/USD buyers.
On a different page, an absence of Chinese players due to the Lunar New Year Holidays and receding fears of the strong recession in 2023 also seemed to have improved the market’s mood and underpinned the AUD/USD pair’s upside, due to its risk-barometer status.
Looking forward, the first readings of January’s S&P Global PMIs for the US will offer intraday directions while Aussie inflation and the US Q4 GDP will be crucial for the week for clear directions.
A 10-week-old ascending resistance line, around 1.0745 by the press time, restricts immediate upside of the AUD/USD pair. The pullback moves, however, remain unimpressive until the quote stays beyond the 200-DMA support level of 0.6815.
Technical Levels: Supports and Resistances
AUDUSD currently trading at 0.7027 at the time of writing. Pair opened at 0.697 and is trading with a change of 0.82 % .
| Overview | Overview.1 | |
|---|---|---|
| 0 | Today last price | 0.7027 |
| 1 | Today Daily Change | 0.0057 |
| 2 | Today Daily Change % | 0.8200 |
| 3 | Today daily open | 0.6970 |
The pair remains strongly bullish on the daily timeframe. It trades above its 20 SMA @ 0.6859, 50 SMA 0.678, 100 SMA @ 0.6641 and 200 SMA @ 0.6819.
| Trends | Trends.1 | |
|---|---|---|
| 0 | Daily SMA20 | 0.6859 |
| 1 | Daily SMA50 | 0.6780 |
| 2 | Daily SMA100 | 0.6641 |
| 3 | Daily SMA200 | 0.6819 |
The previous day high was 0.6974 while the previous day low was 0.6906. The daily 38.2% Fib levels comes at 0.6948, expected to provide support. Similarly, the daily 61.8% fib level is at 0.6932, expected to provide support.
Note the levels of interest below:
- Pivot support is noted at 0.6926, 0.6883, 0.6859
- Pivot resistance is noted at 0.6994, 0.7017, 0.7061
| Levels | Levels.1 |
|---|---|
| Previous Daily High | 0.6974 |
| Previous Daily Low | 0.6906 |
| Previous Weekly High | 0.7064 |
| Previous Weekly Low | 0.6872 |
| Previous Monthly High | 0.6893 |
| Previous Monthly Low | 0.6629 |
| Daily Fibonacci 38.2% | 0.6948 |
| Daily Fibonacci 61.8% | 0.6932 |
| Daily Pivot Point S1 | 0.6926 |
| Daily Pivot Point S2 | 0.6883 |
| Daily Pivot Point S3 | 0.6859 |
| Daily Pivot Point R1 | 0.6994 |
| Daily Pivot Point R2 | 0.7017 |
| Daily Pivot Point R3 | 0.7061 |
[/s2If]
Join Our Telegram Group
")


