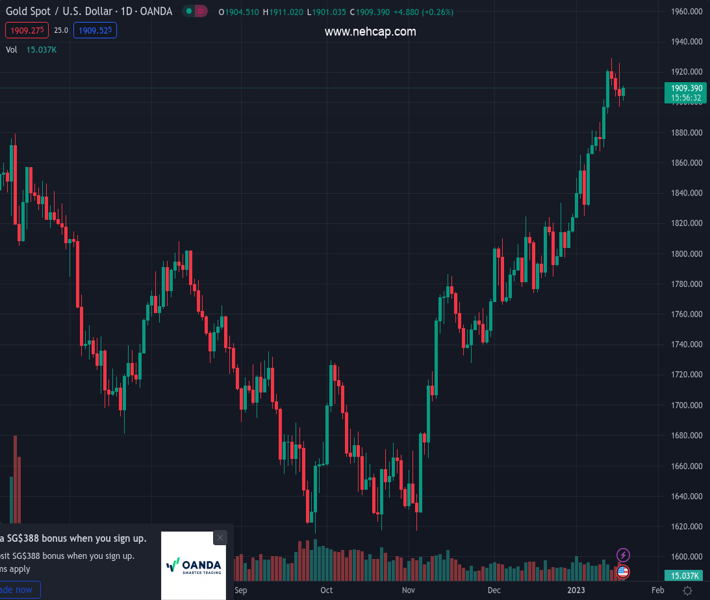
#XAUUSD @ 1,909.42 Gold price has displayed a recovery move and has surpassed $1,910.00 amid weaker yields. (Pivot Orderbook analysis)
…
This is a premium post.
[s2If !current_user_can(access_s2member_level4)]Please register for PREMIUM VERSION HERE to read full post below containing analysis. In case of any error or you think you are not able to read the full post below, please email us at support#nehcap.com [lwa][/s2If] [s2If current_user_can(access_s2member_level4)]
- Gold price has displayed a recovery move and has surpassed $1,910.00 amid weaker yields.
- The absence of demand in the S&P500 futures is restricting risk-perceived currencies in achieving solid upside bias.
- The US Dollar Index has failed to sustain above the critical resistance of 102.00
The pair currently trades last at 1909.42.
The previous day high was 1925.95 while the previous day low was 1896.63. The daily 38.2% Fib levels comes at 1907.83, expected to provide support. Similarly, the daily 61.8% fib level is at 1914.75, expected to provide resistance.
Gold price (XAU/USD) has rebounded firmly and has surpassed the immediate resistance of $1,910.00 in the early European session. The precious metal is gaining strength amid falling returns on US government bonds. The 10-year US Treasury yields has dropped firmly below 3.33% amid falling inflation projections.
Meanwhile, the risk profile is still negative as S&P500 futures are failing to find a cushion. The absence of demand in the S&P500 futures is restricting risk-perceived currencies in achieving solid upside bias. The US Dollar Index (DXY) has shifted its auction profile comfortably below the 102.00 resistance.
US yields are facing severe pressure as Federal Reserve (Fed) policymakers have started considering an interest rate hike by 25 basis points (bps) for February’s monetary policy meeting. Philadelphia Federal Reserve President Patrick Harker reiterated on Wednesday that he’s ready for the US central bank to move to 25 basis points (bps) interest rate hike context amid some signs that hot inflation is cooling off. Also, the CME FedWatch tool displays more than 96% chances of hiking interest rates by bps to 4.50-4.75%.
Gold price has rebounded firmly after testing the horizontal support plotted from January 12 high at $1,901.66 on an hourly scale. The downward-sloping trendline from January 16 high at $1,929.02 will continue to act as a major barricade for the Gold price.
The 100-period Exponential Moving Average (EMA) at $1,905.05 is acting as a major support for Gold price. Also, the Relative Strength Index (RSI) (14) has sensed support around 40.00, which indicates that the downside is restricted.
Technical Levels: Supports and Resistances
XAUUSD currently trading at 1909.56 at the time of writing. Pair opened at 1903.47 and is trading with a change of 0.32 % .
| Overview | Overview.1 | |
|---|---|---|
| 0 | Today last price | 1909.56 |
| 1 | Today Daily Change | 6.09 |
| 2 | Today Daily Change % | 0.32 |
| 3 | Today daily open | 1903.47 |
The pair remains strongly bullish on the daily timeframe. It trades above its 20 SMA @ 1851.62, 50 SMA 1805.76, 100 SMA @ 1739.63 and 200 SMA @ 1776.42.
| Trends | Trends.1 | |
|---|---|---|
| 0 | Daily SMA20 | 1851.62 |
| 1 | Daily SMA50 | 1805.76 |
| 2 | Daily SMA100 | 1739.63 |
| 3 | Daily SMA200 | 1776.42 |
The previous day high was 1925.95 while the previous day low was 1896.63. The daily 38.2% Fib levels comes at 1907.83, expected to provide support. Similarly, the daily 61.8% fib level is at 1914.75, expected to provide resistance.
Note the levels of interest below:
- Pivot support is noted at 1891.42, 1879.36, 1862.1
- Pivot resistance is noted at 1920.74, 1938.0, 1950.06
| Levels | Levels.1 |
|---|---|
| Previous Daily High | 1925.95 |
| Previous Daily Low | 1896.63 |
| Previous Weekly High | 1921.96 |
| Previous Weekly Low | 1865.22 |
| Previous Monthly High | 1833.38 |
| Previous Monthly Low | 1765.89 |
| Daily Fibonacci 38.2% | 1907.83 |
| Daily Fibonacci 61.8% | 1914.75 |
| Daily Pivot Point S1 | 1891.42 |
| Daily Pivot Point S2 | 1879.36 |
| Daily Pivot Point S3 | 1862.10 |
| Daily Pivot Point R1 | 1920.74 |
| Daily Pivot Point R2 | 1938.00 |
| Daily Pivot Point R3 | 1950.06 |
[/s2If]
Join Our Telegram Group
")


