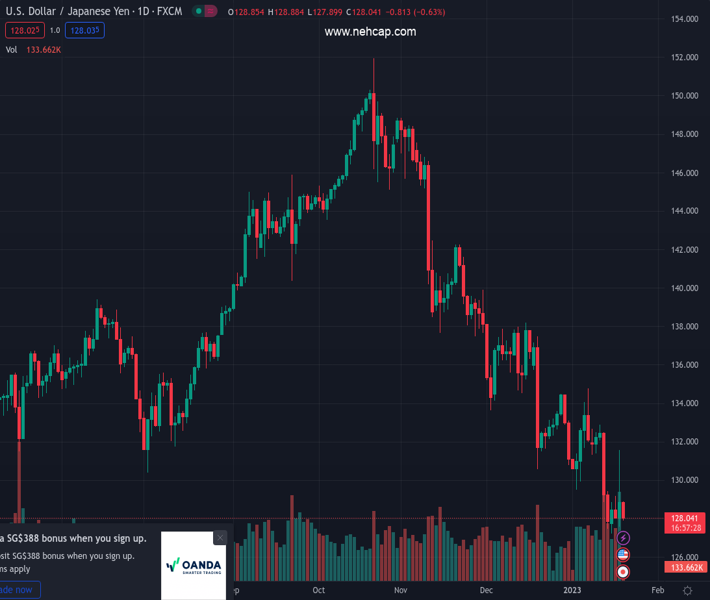
#USDJPY @ 128.036 consolidates the previous day’s gains as yields renew multi-month low. (Pivot Orderbook analysis)
…
This is a premium post.
[s2If !current_user_can(access_s2member_level4)]Please register for PREMIUM VERSION HERE to read full post below containing analysis. In case of any error or you think you are not able to read the full post below, please email us at support#nehcap.com [lwa][/s2If] [s2If current_user_can(access_s2member_level4)]
- USD/JPY consolidates the previous day’s gains as yields renew multi-month low.
- Downbeat Japan trade numbers, fears of softer demand from China and US recession woes fail to stop JPY bulls.
- US Dollar remains depressed amid softer US data, mixed updates.
The pair currently trades last at 128.036.
The previous day high was 131.58 while the previous day low was 127.57. The daily 38.2% Fib levels comes at 130.05, expected to provide resistance. Similarly, the daily 61.8% fib level is at 129.1, expected to provide resistance.
USD/JPY holds lower grounds near 128.00 as it fades the previous day’s run-up amid softer Treasury bond yields, as well as downbeat US Dollar, during early Thursday. In doing so, the Yen pair pays little heed to the fears emanating from downbeat foreign trade numbers from Japan and the US recession concerns.
Japan’s Merchandise Trade Balance Total improved to ¥-1,448.5B in December versus ¥-1,652.8B expected and ¥-2,029B previous readings. However, the details suggest easing Exports and Imports from the previous month. While digging more, Reuters mention that China-bound shipments fell for the first time in seven months.
Elsewhere, US Dollar Index (DXY) traces the downbeat US Treasury bond yields, as well as softer US data, to remain pressured around the lowest levels since May 2022, marked the previous day.
That said, US Retail Sales marked the biggest slump in a year while posting 1.1% MoM contraction for December, versus -0.8% market forecasts and -1.0% prior (revised). On the same line, Producer Price Index dropped to the lowest level in six months with -0.5% MoM figure compared to -0.1% expected and 0.2% prior (revised).
On the other hand, the US 10-year Treasury yields refresh four-month low while the two-year counterpart drops to the lowest levels since early October at the latest.
It’s worth mentioning that the yields on the 10-year Japanese Government Bond (JGB) remain pressured around 0.40% after declining 15% on the Bank of Japan’s (BoJ) inaction the previous day.
It should be observed that China-linked optimism also exerts downside pressure on the USD/JPY pair. While fueling the same, Gita Gopinath, the first Deputy Managing Director of the International Monetary Fund (IMF) said, “China could see a sharp recovery in economic growth from the second quarter onwards based on current infection trends after the dismantling of most COVID-19 restrictions.”
Additionally weighing on the USD/JPY price could be the mostly hawkish comments from the Federal Reserve (Fed) policymakers. St. Louis Federal Reserve’s President James Bullard said US interest rates have to rise further to ensure that inflationary pressures recede. On the same line, President of the Federal Reserve Bank of Cleveland Loretta Mester praised the Fed’s actions to tame inflation. Further, Kansas City Fed President Esther George mentioned that the central bank must restore price stability, “that means returning to 2% inflation.” Recently, Dallas Federal Reserve President Lorie Logan supported a slower rate hike pace but also mentioned possibly a higher stopping point.
Given the lack of major data/events, USD/JPY traders should closely observe the bond market moves, which in turn highlight the yields, for clear directions.
A clear downside break of the weekly support, now resistance around 128.65, directs USD/JPY bears towards the monthly low of 127.21. Also acting as an immediate downside filter is the May 2022 bottom surrounding 126.35.
Technical Levels: Supports and Resistances
USDJPY currently trading at 128.14 at the time of writing. Pair opened at 128.87 and is trading with a change of -0.57% % .
| Overview | Overview.1 | |
|---|---|---|
| 0 | Today last price | 128.14 |
| 1 | Today Daily Change | -0.73 |
| 2 | Today Daily Change % | -0.57% |
| 3 | Today daily open | 128.87 |
The pair remains strongly bearish on the daily time frame. It trades below the 20 SMA @ 131.48, 50 SMA 135.24, 100 SMA @ 140.32 and 200 SMA @ 136.68.
| Trends | Trends.1 | |
|---|---|---|
| 0 | Daily SMA20 | 131.48 |
| 1 | Daily SMA50 | 135.24 |
| 2 | Daily SMA100 | 140.32 |
| 3 | Daily SMA200 | 136.68 |
The previous day high was 131.58 while the previous day low was 127.57. The daily 38.2% Fib levels comes at 130.05, expected to provide resistance. Similarly, the daily 61.8% fib level is at 129.1, expected to provide resistance.
Note the levels of interest below:
- Pivot support is noted at 127.1, 125.33, 123.08
- Pivot resistance is noted at 131.11, 133.35, 135.12
| Levels | Levels.1 |
|---|---|
| Previous Daily High | 131.58 |
| Previous Daily Low | 127.57 |
| Previous Weekly High | 132.87 |
| Previous Weekly Low | 127.46 |
| Previous Monthly High | 138.18 |
| Previous Monthly Low | 130.57 |
| Daily Fibonacci 38.2% | 130.05 |
| Daily Fibonacci 61.8% | 129.10 |
| Daily Pivot Point S1 | 127.10 |
| Daily Pivot Point S2 | 125.33 |
| Daily Pivot Point S3 | 123.08 |
| Daily Pivot Point R1 | 131.11 |
| Daily Pivot Point R2 | 133.35 |
| Daily Pivot Point R3 | 135.12 |
[/s2If]
Join Our Telegram Group
")


