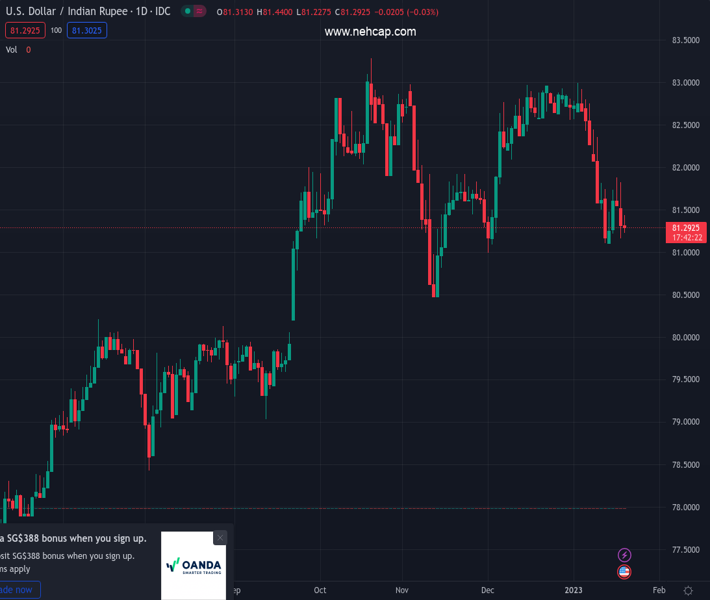
#USDINR @ 81.3000 holds lower ground as bears cheer three-day downtrend amid softer US Dollar. (Pivot Orderbook analysis)
…
This is a premium post.
[s2If !current_user_can(access_s2member_level4)]Please register for PREMIUM VERSION HERE to read full post below containing analysis. In case of any error or you think you are not able to read the full post below, please email us at support#nehcap.com [lwa][/s2If] [s2If current_user_can(access_s2member_level4)]
- USD/INR holds lower ground as bears cheer three-day downtrend amid softer US Dollar.
- Downbeat US data, mixed Fedspeak weigh on the greenback.
- Optimism surrounding China, softer Oil price adds strength to the INR.
The pair currently trades last at 81.3000.
The previous day high was 81.8335 while the previous day low was 81.1555. The daily 38.2% Fib levels comes at 81.4145, expected to provide resistance. Similarly, the daily 61.8% fib level is at 81.5745, expected to provide resistance.
USD/INR stays pressured for the third consecutive day, mildly offered near 81.30 amid the initial hour of Thursday’s Indian trading session. In doing so, the Indian Rupee (INR) pair cheers the broad US Dollar weakness, as well as firmer prices of Oil. Also keeping the INR firmer is the cautious optimism in Asia, mainly due to upbeat concerns surrounding China and softer yields.
WTI crude oil remains pressured for the second consecutive day as it renews the weekly low to $78.25 due to downbeat US data that renewed the recession fears and superseded hopes of more energy demand from China.
US Dollar Index (DXY) snaps three-day rebound, down 0.10% intraday near 102.30, amid mixed Fedspeak and downbeat US data. That said, US Retail Sales marked the biggest slump in a year while posting 1.1% MoM contraction for December, versus -0.8% market forecasts and -1.0% prior (revised). On the same line, Producer Price Index dropped to the lowest level in six months with -0.5% MoM figure compared to -0.1% expected and 0.2% prior (revised).
On the other hand, St. Louis Federal Reserve’s President James Bullard said US interest rates have to rise further to ensure that inflationary pressures recede. On the same line, President of the Federal Reserve Bank of Cleveland Loretta Mester praised the Fed’s actions to tame inflation. Further, Kansas City Fed President Esther George mentioned that the central bank must restore price stability, “that means returning to 2% inflation.” Recently, Dallas Federal Reserve President Lorie Logan supported a slower rate hike pace but also mentioned possibly a higher stopping point.
It should be noted that Gita Gopinath, the first Deputy Managing Director of the International Monetary Fund (IMF) said, “China could see a sharp recovery in economic growth from the second quarter onwards based on current infection trends after the dismantling of most COVID-19 restrictions.”
Amid these plays, S&P 500 Future print mild losses while the US 10-year Treasury yields remain depressed near the lowest level in four months. Further, the stocks in the Asia-Pacific zone trade mixed, mostly firmer, by the press time.
Looking forward, a light calendar and a lack of clarity on macros can keep disturbing USD/INR traders. However, the yields may exert downside pressure on the US Dollar and can help the pair bears to keep the reins.
Failure to cross the 100-DMA hurdle, around 81.75 by the press time, directs USD/INR toward the monthly bottom surrounding 81.07.
Technical Levels: Supports and Resistances
USDINR currently trading at 81.3375 at the time of writing. Pair opened at 81.4251 and is trading with a change of -0.11% % .
| Overview | Overview.1 | |
|---|---|---|
| 0 | Today last price | 81.3375 |
| 1 | Today Daily Change | -0.0876 |
| 2 | Today Daily Change % | -0.11% |
| 3 | Today daily open | 81.4251 |
The pair is trading below its 20 Daily moving average @ 82.2499, below its 50 Daily moving average @ 82.0153 , below its 100 Daily moving average @ 81.7039 and above its 200 Daily moving average @ 80.0304
| Trends | Trends.1 | |
|---|---|---|
| 0 | Daily SMA20 | 82.2499 |
| 1 | Daily SMA50 | 82.0153 |
| 2 | Daily SMA100 | 81.7039 |
| 3 | Daily SMA200 | 80.0304 |
The previous day high was 81.8335 while the previous day low was 81.1555. The daily 38.2% Fib levels comes at 81.4145, expected to provide resistance. Similarly, the daily 61.8% fib level is at 81.5745, expected to provide resistance.
Note the levels of interest below:
- Pivot support is noted at 81.1092, 80.7934, 80.4312
- Pivot resistance is noted at 81.7872, 82.1494, 82.4652
| Levels | Levels.1 |
|---|---|
| Previous Daily High | 81.8335 |
| Previous Daily Low | 81.1555 |
| Previous Weekly High | 82.5294 |
| Previous Weekly Low | 81.0769 |
| Previous Monthly High | 84.2500 |
| Previous Monthly Low | 80.9855 |
| Daily Fibonacci 38.2% | 81.4145 |
| Daily Fibonacci 61.8% | 81.5745 |
| Daily Pivot Point S1 | 81.1092 |
| Daily Pivot Point S2 | 80.7934 |
| Daily Pivot Point S3 | 80.4312 |
| Daily Pivot Point R1 | 81.7872 |
| Daily Pivot Point R2 | 82.1494 |
| Daily Pivot Point R3 | 82.4652 |
[/s2If]
Join Our Telegram Group
")


