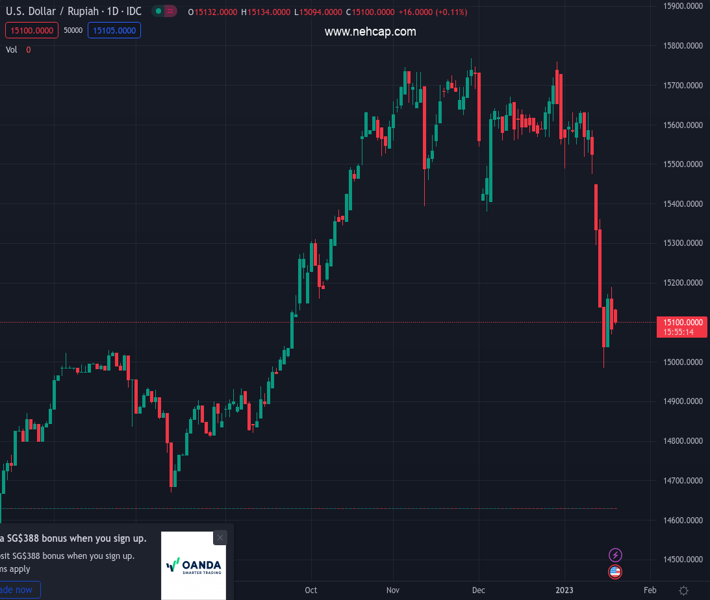
#USDIDR @ 15,110.0 struggles to extend losses despite breaking seven-month-old support line as traders await Bank Indonesia (BI) Rate decision., @nehcap view: Further downside expected (Pivot Orderbook analysis)
…
This is a premium post.
[s2If !current_user_can(access_s2member_level4)]Please register for PREMIUM VERSION HERE to read full post below containing analysis. In case of any error or you think you are not able to read the full post below, please email us at support#nehcap.com [lwa][/s2If] [s2If current_user_can(access_s2member_level4)]
- USD/IDR struggles to extend losses despite breaking seven-month-old support line as traders await Bank Indonesia (BI) Rate decision.
- 200-DMA, oversold RSI conditions also challenge bears around multi-day low.
- Buyers remain off the table unless rising back beyond 100-DMA.
- BI is expected to end the rate-hike cycle with 0.25% lift in benchmark interest rate.
The pair currently trades last at 15110.0.
The previous day high was 15200.85 while the previous day low was 15016.45. The daily 38.2% Fib levels comes at 15086.8908, expected to provide support. Similarly, the daily 61.8% fib level is at 15130.4092, expected to provide resistance.
USD/IDR bears pressure on the key moving average as the key awaits the Bank Indonesia (BI) Rate decision during early Thursday. In doing so, the Indonesia Rupiah (IDR) extends the retreat from seven-month-old previous support to $15,100 by the press time.
That said, the BI is up for the final blow in the fight again inflation as market forecasts suggest the last 0.25% rate hike before the end of monetary policy contraction, at least for now. Bank Indonesia will deliver another 25 basis points interest rate hike on Thursday as it tries to bring inflation under control without having a big impact on economic growth, a Reuters poll of economists forecast.
On the technical front, the quote’s sustained weakness below an upward-sloping trend line from early June 2022 joins the bearish MACD signals to keep the USD/IDR sellers hopeful.
However, the oversold RSI conditions join the 200-DMA, around $15,100 by the press time, to challenge the bears.
Should the quote drops below $15,100, the August 2022 peak surrounding $14,980 and the 61.8% Fibonacci retracement level of the USD/IDR pair’s June-November upside, near $14,910, could challenge the pair sellers.
On the flip side, a daily closing beyond the support-turned-resistance line, close to $15,200 by the press time, appears necessary to recall the USD/IDR bulls.
Even so, the early December swing low near $15,290 and the 100-DMA level around $15,420, could test the upside momentum.
Trend: Further downside expected
Technical Levels: Supports and Resistances
USDIDR currently trading at 15107.75 at the time of writing. Pair opened at 15158.6 and is trading with a change of -0.34% % .
| Overview | Overview.1 | |
|---|---|---|
| 0 | Today last price | 15107.75 |
| 1 | Today Daily Change | -50.8500 |
| 2 | Today Daily Change % | -0.34% |
| 3 | Today daily open | 15158.6 |
The pair is trading below its 20 Daily moving average @ 15486.56, below its 50 Daily moving average @ 15557.033 , below its 100 Daily moving average @ 15416.972 and above its 200 Daily moving average @ 15073.1765
| Trends | Trends.1 | |
|---|---|---|
| 0 | Daily SMA20 | 15486.5600 |
| 1 | Daily SMA50 | 15557.0330 |
| 2 | Daily SMA100 | 15416.9720 |
| 3 | Daily SMA200 | 15073.1765 |
The previous day high was 15200.85 while the previous day low was 15016.45. The daily 38.2% Fib levels comes at 15086.8908, expected to provide support. Similarly, the daily 61.8% fib level is at 15130.4092, expected to provide resistance.
Note the levels of interest below:
- Pivot support is noted at 15049.75, 14940.9, 14865.35
- Pivot resistance is noted at 15234.15, 15309.7, 15418.55
| Levels | Levels.1 |
|---|---|
| Previous Daily High | 15200.8500 |
| Previous Daily Low | 15016.4500 |
| Previous Weekly High | 15635.0000 |
| Previous Weekly Low | 15096.1000 |
| Previous Monthly High | 15797.3500 |
| Previous Monthly Low | 15289.4500 |
| Daily Fibonacci 38.2% | 15086.8908 |
| Daily Fibonacci 61.8% | 15130.4092 |
| Daily Pivot Point S1 | 15049.7500 |
| Daily Pivot Point S2 | 14940.9000 |
| Daily Pivot Point S3 | 14865.3500 |
| Daily Pivot Point R1 | 15234.1500 |
| Daily Pivot Point R2 | 15309.7000 |
| Daily Pivot Point R3 | 15418.5500 |
[/s2If]
Join Our Telegram Group
")


