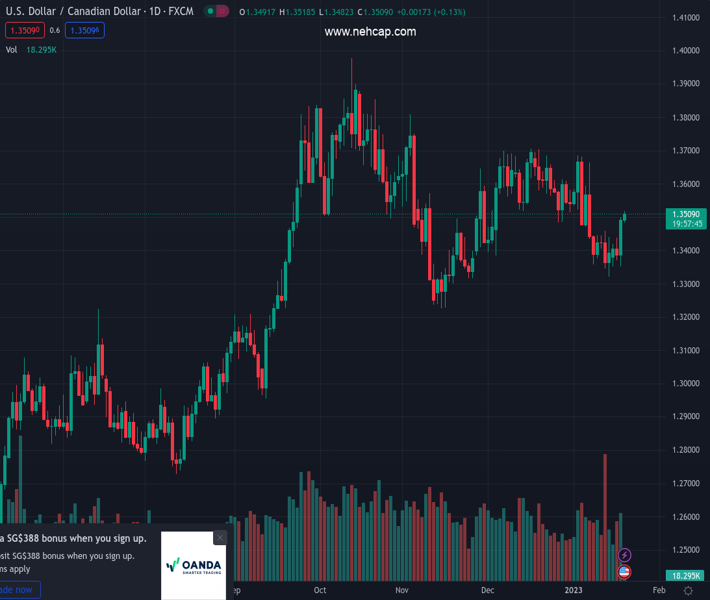
#USDCAD @ 1.35078 grinds higher as buyers jostle with the key hurdle. (Pivot Orderbook analysis)
…
This is a premium post.
[s2If !current_user_can(access_s2member_level4)]Please register for PREMIUM VERSION HERE to read full post below containing analysis. In case of any error or you think you are not able to read the full post below, please email us at support#nehcap.com [lwa][/s2If] [s2If current_user_can(access_s2member_level4)]
- USD/CAD grinds higher as buyers jostle with the key hurdle.
- DXY, yields stabilize after a volatile day, lack of major data/events adds to market’s inaction.
- Mixed Fed talks, China headlines join US recession fears to weigh on Oil price.
The pair currently trades last at 1.35078.
The previous day high was 1.35 while the previous day low was 1.3351. The daily 38.2% Fib levels comes at 1.3443, expected to provide support. Similarly, the daily 61.8% fib level is at 1.3408, expected to provide support.
USD/CAD seesaws near 1.3500-3510 as bulls struggle to overcome the key resistance, namely the 100-DMA, during early Thursday. In doing so, the Loonie pair justifies the steady US Dollar Index (DXY) amid inactive markets. However, the downbeat prices of Canada’s key export item, namely WTI crude oil, underpin the upside momentum.
That said, WTI crude oil sellers poke the weekly low surrounding $78.80 as downbeat US data renewed the recession fears, which in turn superseded hopes of more energy demand from China.
On Wednesday, US Retail Sales marked the biggest slump in a year while posting 1.1% MoM contraction for December, versus -0.8% market forecasts and -1.0% prior (revised). On the same line, Producer Price Index dropped to the lowest level in six months with -0.5% MoM figure compared to -0.1% expected and 0.2% prior (revised).
Alternatively, Gita Gopinath, the first Deputy Managing Director of the International Monetary Fund (IMF) said, “China could see a sharp recovery in economic growth from the second quarter onwards based on current infection trends after the dismantling of most COVID-19 restrictions.”
At home, a softening of the Canada Industrial Production and Raw Material Price Index for December also favor the USD/CAD buyers. That said, the industrial output contracted 1.1% versus -0.3% forecast and 0.5% revised prior while the Raw Material Price slumped to -3.1% from -0.8% prior and -1.3% market consensus.
It’s worth mentioning that the mixed comments by the Fed policymakers also confuse USD/CAD bulls amid an absence of major data/events. St. Louis Federal Reserve’s President James Bullard said US interest rates have to rise further to ensure that inflationary pressures recede. On the same line, President of the Federal Reserve Bank of Cleveland Loretta Mester praised the Fed’s actions to tame inflation.
Further, Kansas City Fed President Esther George mentioned that the central bank must restore price stability, “that means returning to 2% inflation.” Recently, Dallas Federal Reserve President Lorie Logan supported a slower rate hike pace but also mentioned possibly a higher stopping point.
Against this backdrop, S&P 500 Future print mild losses while the US 10-year Treasury yields remain inactive around the lowest level in four months.
Looking forward, a light calendar and mixed risk catalysts could challenge the USD/CAD traders ahead of Friday’s key Retail Sales.
Although the 100-DMA hurdle challenges the USD/CAD pair’s immediate upside near 1.3510, the looming bull cross on the MACD and steady RSI (14) keep buyers hopeful of witnessing further advances of the Loonie pair.
Technical Levels: Supports and Resistances
USDCAD currently trading at 1.3506 at the time of writing. Pair opened at 1.35 and is trading with a change of 0.04% % .
| Overview | Overview.1 | |
|---|---|---|
| 0 | Today last price | 1.3506 |
| 1 | Today Daily Change | 0.0006 |
| 2 | Today Daily Change % | 0.04% |
| 3 | Today daily open | 1.35 |
The pair is trading above its 20 Daily moving average @ 1.3505, above its 50 Daily moving average @ 1.3495 , below its 100 Daily moving average @ 1.3507 and above its 200 Daily moving average @ 1.3182
| Trends | Trends.1 | |
|---|---|---|
| 0 | Daily SMA20 | 1.3505 |
| 1 | Daily SMA50 | 1.3495 |
| 2 | Daily SMA100 | 1.3507 |
| 3 | Daily SMA200 | 1.3182 |
The previous day high was 1.35 while the previous day low was 1.3351. The daily 38.2% Fib levels comes at 1.3443, expected to provide support. Similarly, the daily 61.8% fib level is at 1.3408, expected to provide support.
Note the levels of interest below:
- Pivot support is noted at 1.3401, 1.3301, 1.3251
- Pivot resistance is noted at 1.355, 1.36, 1.3699
| Levels | Levels.1 |
|---|---|
| Previous Daily High | 1.3500 |
| Previous Daily Low | 1.3351 |
| Previous Weekly High | 1.3461 |
| Previous Weekly Low | 1.3322 |
| Previous Monthly High | 1.3705 |
| Previous Monthly Low | 1.3385 |
| Daily Fibonacci 38.2% | 1.3443 |
| Daily Fibonacci 61.8% | 1.3408 |
| Daily Pivot Point S1 | 1.3401 |
| Daily Pivot Point S2 | 1.3301 |
| Daily Pivot Point S3 | 1.3251 |
| Daily Pivot Point R1 | 1.3550 |
| Daily Pivot Point R2 | 1.3600 |
| Daily Pivot Point R3 | 1.3699 |
[/s2If]
Join Our Telegram Group
")


