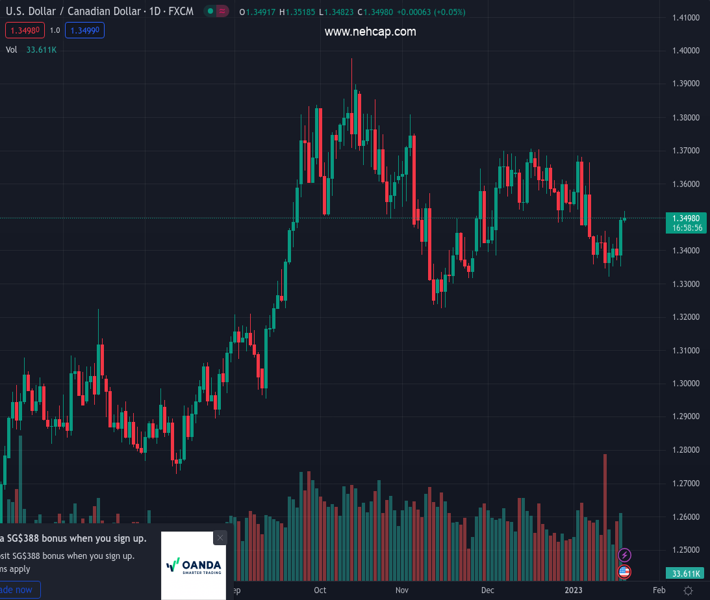
#USDCAD @ 1.34969 hits a nearly two-week high on Thursday, albeit lacks follow-through. (Pivot Orderbook analysis)
…
This is a premium post.
[s2If !current_user_can(access_s2member_level4)]Please register for PREMIUM VERSION HERE to read full post below containing analysis. In case of any error or you think you are not able to read the full post below, please email us at support#nehcap.com [lwa][/s2If] [s2If current_user_can(access_s2member_level4)]
- USD/CAD hits a nearly two-week high on Thursday, albeit lacks follow-through.
- Retreating crude oil prices undermines the Loonie and lends support to the major.
- Falling US bond yields keep the USD bulls on the defensive and act as a headwind.
The pair currently trades last at 1.34969.
The previous day high was 1.35 while the previous day low was 1.3351. The daily 38.2% Fib levels comes at 1.3443, expected to provide support. Similarly, the daily 61.8% fib level is at 1.3408, expected to provide support.
The USD/CAD pair adds to the overnight strong gains and edges higher for the second successive day on Thursday. Spot prices touch a one-and-half-week high during the Asian session, albeit seem to struggle to find acceptance above the 1.3500 psychological mark or build on the momentum beyond the 100-day SMA.
A further pullback in crude oil prices, from the highest level since December 5 touched on Wednesday, undermines the commodity-linked Loonie and acts as a tailwind for the USD/CAD pair. Investors remain concerned about the fuel demand outlook amid growing worries about a deeper global economic downturn. Adding to this, data from the American Petroleum Institute (API) signalled another big weekly build in US crude inventories and exerts pressure on the black liquid.
The US Dollar, on the other hand, is weighed down by the ongoing slide in the US Treasury bond yields, which, in turn, is holding back bulls from placing aggressive bets around the USD/CAD pair. In fact, the
yield on the rate-sensitive two-year US government bond drops to its lowest level since October amid expectations for a less aggressive policy tightening by the Fed. The bets were further lifted by weaker-than-expected US macroeconomic released on Wednesday.
That said, several FOMC members indicated on Wednesday that they will push on with more interest rate hikes even as inflation shows signs of easing and economic activity is slowing. Apart from this, looming recession fears temper investors’ appetite for riskier assets. This is evident from a softer tone around the equity markets, which is seen benefitting the safe-haven greenback and supports prospects for a further appreciating move for the USD/CAD pair.
Market participants now look forward to the US economic docket, featuring the release of the Philly Fed Manufacturing Index, the usual Weekly Initial Jobless Claims and housing market data. This, along with speeches by Fed officials, the US bond yields and the broader risk sentiment, might influence the USD demand later this Thursday. Apart from this, traders will take cues from oil price dynamics to grab short-term opportunities around the USD/CAD pair.
Technical Levels: Supports and Resistances
USDCAD currently trading at 1.35 at the time of writing. Pair opened at 1.35 and is trading with a change of 0.0 % .
| Overview | Overview.1 | |
|---|---|---|
| 0 | Today last price | 1.35 |
| 1 | Today Daily Change | 0.00 |
| 2 | Today Daily Change % | 0.00 |
| 3 | Today daily open | 1.35 |
The pair is trading below its 20 Daily moving average @ 1.3505, above its 50 Daily moving average @ 1.3495 , below its 100 Daily moving average @ 1.3507 and above its 200 Daily moving average @ 1.3182
| Trends | Trends.1 | |
|---|---|---|
| 0 | Daily SMA20 | 1.3505 |
| 1 | Daily SMA50 | 1.3495 |
| 2 | Daily SMA100 | 1.3507 |
| 3 | Daily SMA200 | 1.3182 |
The previous day high was 1.35 while the previous day low was 1.3351. The daily 38.2% Fib levels comes at 1.3443, expected to provide support. Similarly, the daily 61.8% fib level is at 1.3408, expected to provide support.
Note the levels of interest below:
- Pivot support is noted at 1.3401, 1.3301, 1.3251
- Pivot resistance is noted at 1.355, 1.36, 1.3699
| Levels | Levels.1 |
|---|---|
| Previous Daily High | 1.3500 |
| Previous Daily Low | 1.3351 |
| Previous Weekly High | 1.3461 |
| Previous Weekly Low | 1.3322 |
| Previous Monthly High | 1.3705 |
| Previous Monthly Low | 1.3385 |
| Daily Fibonacci 38.2% | 1.3443 |
| Daily Fibonacci 61.8% | 1.3408 |
| Daily Pivot Point S1 | 1.3401 |
| Daily Pivot Point S2 | 1.3301 |
| Daily Pivot Point S3 | 1.3251 |
| Daily Pivot Point R1 | 1.3550 |
| Daily Pivot Point R2 | 1.3600 |
| Daily Pivot Point R3 | 1.3699 |
[/s2If]
Join Our Telegram Group
")


