#NZDUSD @ 0.64155 trades with modest losses on Thursday, though the downside remains cushioned. (Pivot Orderbook analysis)
…
This is a premium post.
[s2If !current_user_can(access_s2member_level4)]Please register for PREMIUM VERSION HERE to read full post below containing analysis. In case of any error or you think you are not able to read the full post below, please email us at support#nehcap.com [lwa][/s2If] [s2If current_user_can(access_s2member_level4)]
- NZD/USD trades with modest losses on Thursday, though the downside remains cushioned.
- Looming recession risks weigh on investors’ sentiment and undermine the risk-sensitive Kiwi.
- Subdued USD price action lends some support to the major and helps limit any deeper losses.
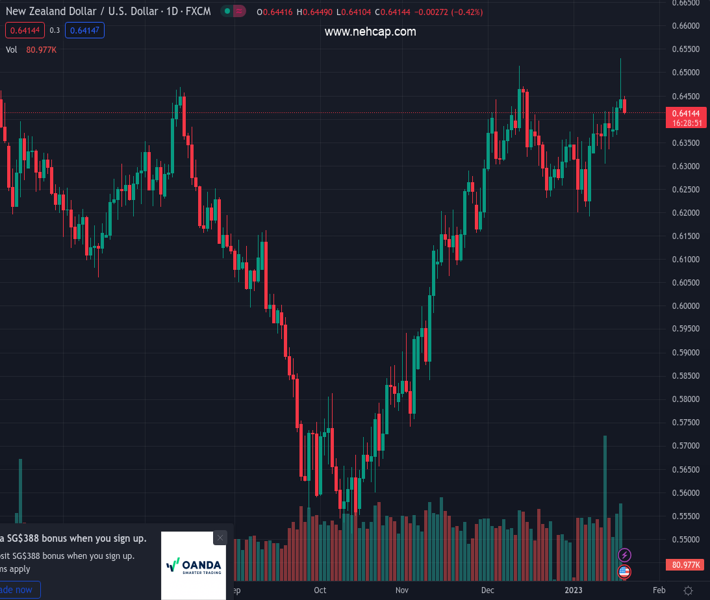
The pair currently trades last at 0.64155.
The previous day high was 0.6531 while the previous day low was 0.637. The daily 38.2% Fib levels comes at 0.6469, expected to provide resistance. Similarly, the daily 61.8% fib level is at 0.6431, expected to provide resistance.
The NZD/USD pair edges lower during the Asian session on Thursday and moves away from its highest level since June 2022, around the 0.6530 area touched the previous day. Spot prices, however, manage to hold above the 0.6400 mark, making it prudent to wait for strong follow-through selling before positioning for any further intraday downfall.
The weaker US macro data released on Wednesday adds to worries about a deeper global economic downturn and continues to weigh on investors’ sentiment. This is evident from a softer tone around the equity markets and acts as a headwind for the risk-sensitive Kiwi, which reacts little to news that Prime Minister Jacinda Ardern will step down next month. That said, subdued US Dollar price action lends some support to the NZD/USD pair and helps limit the downside, at least for the time being.
A further decline in the US Treasury bond yields, amid firming expectations for a less aggressive policy tightening by the Fed, keeps the USD bulls on the defensive. In fact, the markets now seem convinced that the US central bank will soften its stance and have been pricing in a smaller 25 bps rate hike in February. The bets were reaffirmed by the US data, showing that retail sales in December fell by the most in a year and manufacturing output recorded its biggest drop in nearly two years.
That said, several FOMC members indicated on Wednesday that they will push on with more interest rate hikes even as inflation shows signs of easing and economic activity is slowing. Apart from this, looming recession risks should benefit the greenback’s relative safe-haven status and exert some downward pressure on the NZD/USD pair. Traders now look to the US economic docket, featuring the Philly Fed Manufacturing Index, the usual Weekly Initial Jobless Claims and housing market data.
This, along with speeches by Fed officials and the US bond yields, might influence the USD price dynamics later during the early North American session. Apart from this, traders will take cues from the broader risk sentiment to grab short-term opportunities around the NZD/USD pair. Nevertheless, the mixed fundamental backdrop warrants some caution before placing aggressive directional bets.
Technical Levels: Supports and Resistances
NZDUSD currently trading at 0.6415 at the time of writing. Pair opened at 0.6429 and is trading with a change of -0.22 % .
| Overview | Overview.1 | |
|---|---|---|
| 0 | Today last price | 0.6415 |
| 1 | Today Daily Change | -0.0014 |
| 2 | Today Daily Change % | -0.2200 |
| 3 | Today daily open | 0.6429 |
The pair remains strongly bullish on the daily timeframe. It trades above its 20 SMA @ 0.6334, 50 SMA 0.6296, 100 SMA @ 0.6057 and 200 SMA @ 0.6204.
| Trends | Trends.1 | |
|---|---|---|
| 0 | Daily SMA20 | 0.6334 |
| 1 | Daily SMA50 | 0.6296 |
| 2 | Daily SMA100 | 0.6057 |
| 3 | Daily SMA200 | 0.6204 |
The previous day high was 0.6531 while the previous day low was 0.637. The daily 38.2% Fib levels comes at 0.6469, expected to provide resistance. Similarly, the daily 61.8% fib level is at 0.6431, expected to provide resistance.
Note the levels of interest below:
- Pivot support is noted at 0.6356, 0.6282, 0.6194
- Pivot resistance is noted at 0.6517, 0.6604, 0.6678
| Levels | Levels.1 |
|---|---|
| Previous Daily High | 0.6531 |
| Previous Daily Low | 0.6370 |
| Previous Weekly High | 0.6418 |
| Previous Weekly Low | 0.6314 |
| Previous Monthly High | 0.6514 |
| Previous Monthly Low | 0.6230 |
| Daily Fibonacci 38.2% | 0.6469 |
| Daily Fibonacci 61.8% | 0.6431 |
| Daily Pivot Point S1 | 0.6356 |
| Daily Pivot Point S2 | 0.6282 |
| Daily Pivot Point S3 | 0.6194 |
| Daily Pivot Point R1 | 0.6517 |
| Daily Pivot Point R2 | 0.6604 |
| Daily Pivot Point R3 | 0.6678 |
[/s2If]
Join Our Telegram Group
")


