#GBPUSD @ 1.23424 treads water as bulls and bears jostle between crucial resistance and support., @nehcap view: Sideways (Pivot Orderbook analysis)
…
This is a premium post.
[s2If !current_user_can(access_s2member_level4)]Please register for PREMIUM VERSION HERE to read full post below containing analysis. In case of any error or you think you are not able to read the full post below, please email us at support#nehcap.com [lwa][/s2If] [s2If current_user_can(access_s2member_level4)]
- GBP/USD treads water as bulls and bears jostle between crucial resistance and support.
- Looming bear cross on MACD, failure to cross 1.2450 hurdle tease sellers.
- Two-week-old ascending trend line, 200-SMA limit downside moves.
- RSI conditions suggest further grinding towards the north.
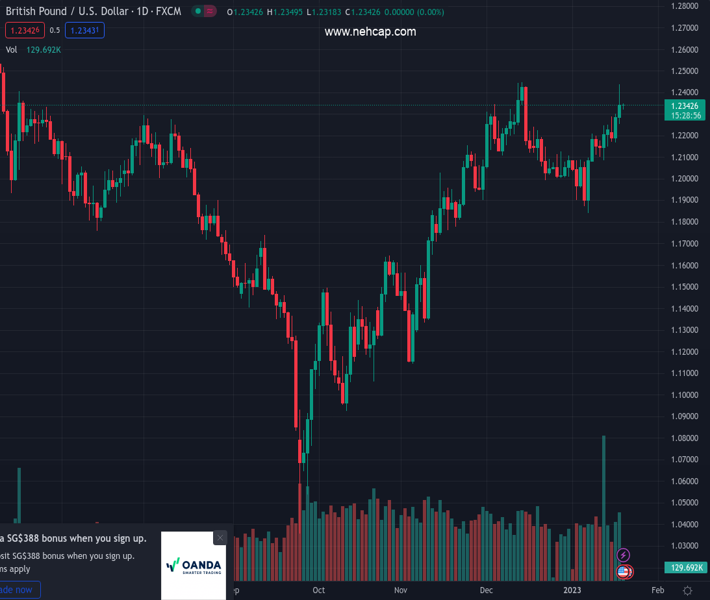
The pair currently trades last at 1.23424.
The previous day high was 1.2436 while the previous day low was 1.2255. The daily 38.2% Fib levels comes at 1.2367, expected to provide resistance. Similarly, the daily 61.8% fib level is at 1.2324, expected to provide support.
GBP/USD struggles for clear directions as it floats around 1.2330 amid the initial hour of London open on Thursday. In doing so, the Cable pair trades within an important trading region amid contrasting oscillators.
That said, a five-week-old horizontal resistance area restricts the GBP/USD pair’s immediate upside to around 1.2450 while an ascending trend line from January 06, close to 1.2260 at the latest, challenges the bears.
It’s worth noting that the MACD signals are losing the bullish bias but the RSI (14) defends the two-week-old bullish bias despite the latest retreat.
In addition to the 1.2260 support, the 200-SMA level surrounding 1.2155 and the 1.2000 psychological magnet also challenge the GBP/USD sellers, making it harder for them to retake control.
Should the quote drops below the 1.2000 mark, a south-run to refresh the monthly low, currently around 1.1841, can’t be ruled out.
Alternatively, an upside break of 1.2450 will confirm the “rounding bottom” bullish chart pattern that theoretically suggests a rally towards 1.3050.
However, the May 2022 high of 1.2665 and the late April 2022 low of 1.2975 could act as additional upside filters to challenge the GBP/USD buyers during the aforementioned rally.
Trend: Sideways
Technical Levels: Supports and Resistances
GBPUSD currently trading at 1.2338 at the time of writing. Pair opened at 1.2338 and is trading with a change of 0.00% % .
| Overview | Overview.1 | |
|---|---|---|
| 0 | Today last price | 1.2338 |
| 1 | Today Daily Change | 0.0000 |
| 2 | Today Daily Change % | 0.00% |
| 3 | Today daily open | 1.2338 |
The pair remains strongly bullish on the daily timeframe. It trades above its 20 SMA @ 1.2108, 50 SMA 1.2086, 100 SMA @ 1.1707 and 200 SMA @ 1.1985.
| Trends | Trends.1 | |
|---|---|---|
| 0 | Daily SMA20 | 1.2108 |
| 1 | Daily SMA50 | 1.2086 |
| 2 | Daily SMA100 | 1.1707 |
| 3 | Daily SMA200 | 1.1985 |
The previous day high was 1.2436 while the previous day low was 1.2255. The daily 38.2% Fib levels comes at 1.2367, expected to provide resistance. Similarly, the daily 61.8% fib level is at 1.2324, expected to provide support.
Note the levels of interest below:
- Pivot support is noted at 1.225, 1.2162, 1.2068
- Pivot resistance is noted at 1.2431, 1.2524, 1.2613
| Levels | Levels.1 |
|---|---|
| Previous Daily High | 1.2436 |
| Previous Daily Low | 1.2255 |
| Previous Weekly High | 1.2249 |
| Previous Weekly Low | 1.2086 |
| Previous Monthly High | 1.2447 |
| Previous Monthly Low | 1.1992 |
| Daily Fibonacci 38.2% | 1.2367 |
| Daily Fibonacci 61.8% | 1.2324 |
| Daily Pivot Point S1 | 1.2250 |
| Daily Pivot Point S2 | 1.2162 |
| Daily Pivot Point S3 | 1.2068 |
| Daily Pivot Point R1 | 1.2431 |
| Daily Pivot Point R2 | 1.2524 |
| Daily Pivot Point R3 | 1.2613 |
[/s2If]
Join Our Telegram Group
")


