#GBPUSD @ 1.23272 retreats from five-week high, snaps two-day winning streak., @nehcap view: Limited downside expected (Pivot Orderbook analysis)
…
This is a premium post.
[s2If !current_user_can(access_s2member_level4)]Please register for PREMIUM VERSION HERE to read full post below containing analysis. In case of any error or you think you are not able to read the full post below, please email us at support#nehcap.com [lwa][/s2If] [s2If current_user_can(access_s2member_level4)]
- GBP/USD retreats from five-week high, snaps two-day winning streak.
- Break of immediate support line, downbeat oscillators favor bears.
- Convergence of 100-HMA, fortnight-long ascending trend line appears a tough nut to crack for sellers.
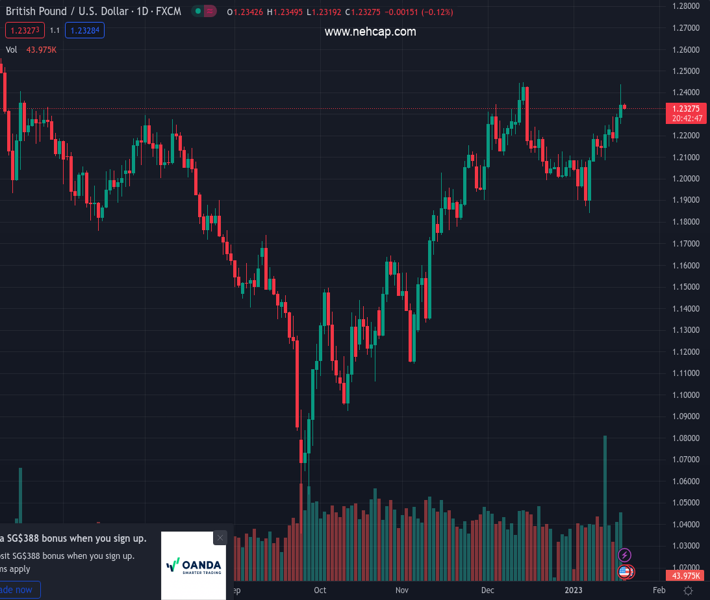
The pair currently trades last at 1.23272.
The previous day high was 1.2436 while the previous day low was 1.2255. The daily 38.2% Fib levels comes at 1.2367, expected to provide resistance. Similarly, the daily 61.8% fib level is at 1.2324, expected to provide support.
GBP/USD takes offers to refresh the intraday low near 1.2320 after breaking an immediate support line during early Thursday. In doing so, the Cable pair extends late Wednesday’s pullback from the highest level since December 14, 2022, while printing the first daily loss in three.
Not only the downside break of the immediate trend line but bearish MACD signals and the RSI (14) pullback from the overbought territory also suggest the continuation of the latest declines by the Cable pair.
That said, the tops marked during Monday and Tuesday, around 1.2290, offer nearly support to the quote. However, a convergence of the 100-Hour Moving Average (HMA) and an ascending trend line from January 06, close to 1.2250 by the press time, could challenge the GBP/USD bears afterward.
In a case where the pair remains bearish past the 1.2250 support confluence, the 200-HMA level near the 1.2200 round figure could act as the final defense of the GBP/USD buyers.
Alternatively, recovery moves need to cross the support-turned-resistance line stretched from Tuesday, close to 1.2350 by the press time.
Following that, a run-up towards the 1.2400 round figure and the recent peak surrounding 1.2435 can’t be ruled out. It should be observed that the previous monthly peak near 1.2450 will act as an additional upside filter to watch for the GBP/USD bulls.
Trend: Limited downside expected
Technical Levels: Supports and Resistances
GBPUSD currently trading at 1.232 at the time of writing. Pair opened at 1.2338 and is trading with a change of -0.15% % .
| Overview | Overview.1 | |
|---|---|---|
| 0 | Today last price | 1.232 |
| 1 | Today Daily Change | -0.0018 |
| 2 | Today Daily Change % | -0.15% |
| 3 | Today daily open | 1.2338 |
The pair remains strongly bullish on the daily timeframe. It trades above its 20 SMA @ 1.2108, 50 SMA 1.2086, 100 SMA @ 1.1707 and 200 SMA @ 1.1985.
| Trends | Trends.1 | |
|---|---|---|
| 0 | Daily SMA20 | 1.2108 |
| 1 | Daily SMA50 | 1.2086 |
| 2 | Daily SMA100 | 1.1707 |
| 3 | Daily SMA200 | 1.1985 |
The previous day high was 1.2436 while the previous day low was 1.2255. The daily 38.2% Fib levels comes at 1.2367, expected to provide resistance. Similarly, the daily 61.8% fib level is at 1.2324, expected to provide support.
Note the levels of interest below:
- Pivot support is noted at 1.225, 1.2162, 1.2068
- Pivot resistance is noted at 1.2431, 1.2524, 1.2613
| Levels | Levels.1 |
|---|---|
| Previous Daily High | 1.2436 |
| Previous Daily Low | 1.2255 |
| Previous Weekly High | 1.2249 |
| Previous Weekly Low | 1.2086 |
| Previous Monthly High | 1.2447 |
| Previous Monthly Low | 1.1992 |
| Daily Fibonacci 38.2% | 1.2367 |
| Daily Fibonacci 61.8% | 1.2324 |
| Daily Pivot Point S1 | 1.2250 |
| Daily Pivot Point S2 | 1.2162 |
| Daily Pivot Point S3 | 1.2068 |
| Daily Pivot Point R1 | 1.2431 |
| Daily Pivot Point R2 | 1.2524 |
| Daily Pivot Point R3 | 1.2613 |
[/s2If]
Join Our Telegram Group
")


