#EURUSD @ 1.08328 is aiming to sustain above 1.0800 as the USD Index is displaying a subdued performance. (Pivot Orderbook analysis)
…
This is a premium post.
[s2If !current_user_can(access_s2member_level4)]Please register for PREMIUM VERSION HERE to read full post below containing analysis. In case of any error or you think you are not able to read the full post below, please email us at support#nehcap.com [lwa][/s2If] [s2If current_user_can(access_s2member_level4)]
- EUR/USD is aiming to sustain above 1.0800 as the USD Index is displaying a subdued performance.
- Accelerating odds of a slower interest rate hike by the Federal Reserve have weakened US Treasury yields.
- The speech from European Central Bank President Christine Lagarde will guide investors about the likely policy action ahead.
- EUR/USD is looking for demand around the upward-sloping trendline of the Ascending Triangle.
The pair currently trades last at 1.08328.
The previous day high was 1.0888 while the previous day low was 1.0766. The daily 38.2% Fib levels comes at 1.0813, expected to provide support. Similarly, the daily 61.8% fib level is at 1.0841, expected to provide resistance.
The EUR/USD pair has managed to claim the critical resistance of 1.0800 in early Europe after remaining sideways in the Asian session. The major currency pair is aiming to deliver a recovery move after a vertical fall as the US Dollar index (DXY) is losing traction. The Euro still needs to clear more filters to infuse confidence in the sentiment of the market participants for a recovery move.
The US Dollar Index is struggling to sustain above the crucial resistance of 102.00 as investors are still in a fix on whether to pump liquidity into the safe-haven assets due to hawkish commentary from the Federal Reserve (Fed) policymakers or to dump the USD Index due to declining inflation projections in the United States.
Meanwhile, S&P500 futures have shown a marginal recovery after facing heat in the Asian session. However, the 500-stock basket futures still need to prove more to improve traction for the risk-appetite theme.
Solidifying case for a slowdown in the pace of hiking interest rates by the Federal Reserve is weighing heavily on the alpha generated by the US government bonds.
Wednesday’s lower United States Producer Price Index (PPI) and weaker Retail Sales data dragged US Treasury yields to a multi-month low. The 10-year US Treasury yields recorded a fresh four-month low below 3.33%. And, the two-year US Treasury yields dropped to a fresh three-month low near 4.07%.
The context that impacted heavily on yields is the decline in PPI numbers against expectations. The headline US PPI dropped to 6.2% and the core PPI that excludes oil and food prices trimmed to 5.5%. Lower prices of goods and services at factory gates come when producers feel that current prices are unable to fetch demand from the public. Therefore, softening of demanded price would maintain equilibrium with weakened retail demand and eventually push the overall inflation to the south side.
No doubt that the cool-off in the ultra-hot inflation has provided confidence to the Federal Reserve policymakers to sound-less hawkish for further hikes in interest rates. Reuters reports that Philadelphia Federal Reserve President Patrick Harker reiterated on Wednesday that he’s ready for the US central bank to move to 25 basis points (bps) interest rate hike context amid some signs that hot inflation is cooling off.
After finding confidence that the inflation rate will continue its downward trend, Federal Reserve policymakers have started focusing on the lower extent of the interest rate hike. However, the higher projection for terminal rate and the maintenance of higher interest rates for a longer period is still supporting the US Dollar Index and impacting the risk-taking capacity of investors.
Projections of St. Louis Fed’s President James Bullard state that the interest rate peak will be in a 5.25-5.50% range. This might trigger a further slowdown in economic activities. Analysts at Wells Fargo stated that US Industrial Production fell 0.7% in December and November’s numbers were revised lower. With industrial production has fallen in six of the past eight months, the largest of which being November and December, it is evident that the manufacturing sector is already in recession.
On Thursday, the speech from the European Central Bank (ECB) President Christine Lagarde will guide investors about the likely monetary policy action in February. Declining energy prices in Eurozone have softened inflation, however, the current inflation rate is still far from the median rate. Therefore, investors should brace for a hawkish commentary from European Central Bank’s Lagarde ahead.
According to economists polled by Bloomberg, the deposit rate will be raised to a peak of 3.25% from its current level of 2% in three steps. The survey shows two half-point hikes at the February and March meetings, followed by a 25 basis-point increase in May or June.
Meanwhile, European Central Bank (ECB) policymaker Francois Villeroy de Galhau said on Wednesday, it’s “too early to speculate about what we will do in March.” However, he believed that Lagarde’s earlier 50 bps guidance is still valid.
EUR/USD is looking to find support around the upward-sloping trendline of the Ascending Triangle chart pattern plotted from January 10 low at 1.0712 on an hourly scale. The horizontal resistance of the aforementioned chart pattern is placed from January 12 high at 1.0867.
The 20-period Exponential Moving Average (EMA) at 1.0800 is acting as a major barrier for the Euro. While, the 200-EMA at 1.0774 is still advancing, which indicates that the upside trend is still solid.
Meanwhile, the Relative Strength Index (RSI) (14) is oscillating in a 40.00-60.00 range, which indicates a consolidation ahead.
Technical Levels: Supports and Resistances
EURUSD currently trading at 1.0796 at the time of writing. Pair opened at 1.0789 and is trading with a change of 0.06 % .
| Overview | Overview.1 | |
|---|---|---|
| 0 | Today last price | 1.0796 |
| 1 | Today Daily Change | 0.0007 |
| 2 | Today Daily Change % | 0.0600 |
| 3 | Today daily open | 1.0789 |
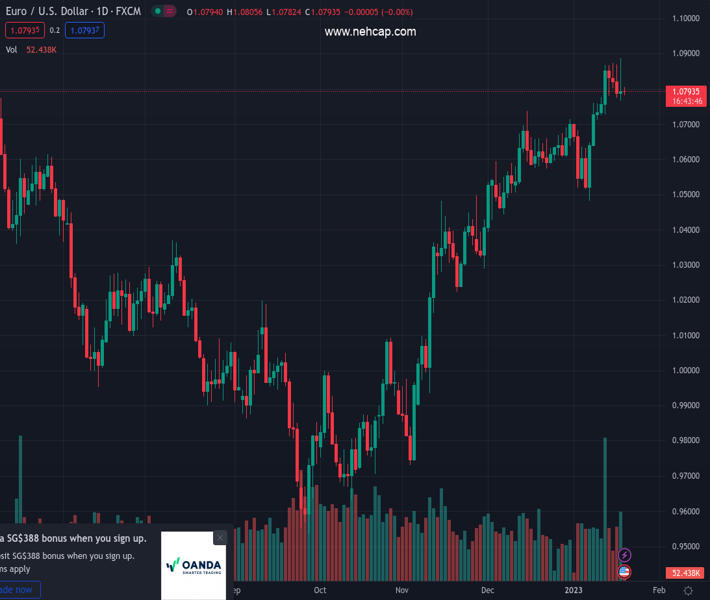
The pair remains strongly bullish on the daily timeframe. It trades above its 20 SMA @ 1.0687, 50 SMA 1.0548, 100 SMA @ 1.0214 and 200 SMA @ 1.031.
| Trends | Trends.1 | |
|---|---|---|
| 0 | Daily SMA20 | 1.0687 |
| 1 | Daily SMA50 | 1.0548 |
| 2 | Daily SMA100 | 1.0214 |
| 3 | Daily SMA200 | 1.0310 |
The previous day high was 1.0888 while the previous day low was 1.0766. The daily 38.2% Fib levels comes at 1.0813, expected to provide support. Similarly, the daily 61.8% fib level is at 1.0841, expected to provide resistance.
Note the levels of interest below:
- Pivot support is noted at 1.0741, 1.0693, 1.062
- Pivot resistance is noted at 1.0862, 1.0936, 1.0984
| Levels | Levels.1 |
|---|---|
| Previous Daily High | 1.0888 |
| Previous Daily Low | 1.0766 |
| Previous Weekly High | 1.0868 |
| Previous Weekly Low | 1.0639 |
| Previous Monthly High | 1.0736 |
| Previous Monthly Low | 1.0393 |
| Daily Fibonacci 38.2% | 1.0813 |
| Daily Fibonacci 61.8% | 1.0841 |
| Daily Pivot Point S1 | 1.0741 |
| Daily Pivot Point S2 | 1.0693 |
| Daily Pivot Point S3 | 1.0620 |
| Daily Pivot Point R1 | 1.0862 |
| Daily Pivot Point R2 | 1.0936 |
| Daily Pivot Point R3 | 1.0984 |
[/s2If]
Join Our Telegram Group
")


