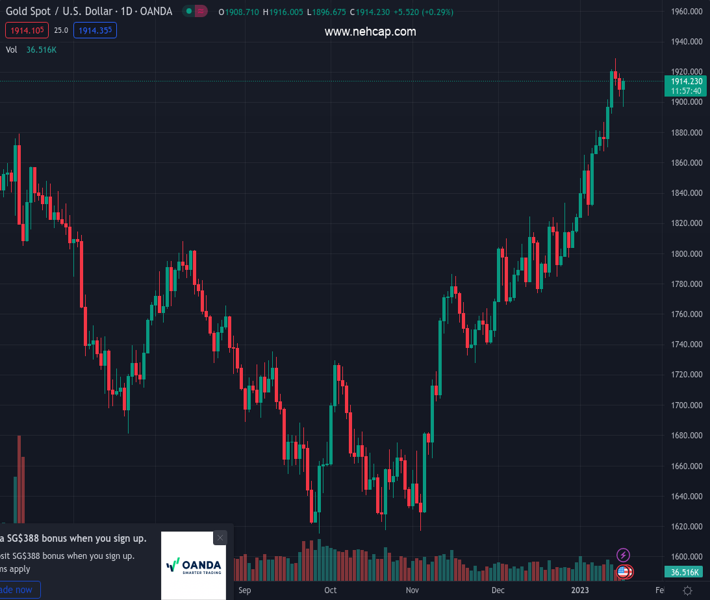
#XAUUSD @ 1,914.41 Gold price stages a decent comeback as US Dollar falls with Treasury bond yields.
…
This is a premium post.
[s2If !current_user_can(access_s2member_level4)]Please register for PREMIUM VERSION HERE to read full post below containing analysis. In case of any error or you think you are not able to read the full post below, please email us at support#nehcap.com [lwa][/s2If] [s2If current_user_can(access_s2member_level4)]
- Gold price stages a decent comeback as US Dollar falls with Treasury bond yields.
- USD/JPY reversal post-BoJ also weighs down on the US Dollar ahead of US data.
- Gold price needs to take out the key $1,918 barrier to resume the uptrend.
Gold price has stalled its ongoing corrective downside, staging a decent comeback so far this Wednesday. The US Dollar has reversed its early gains amid falling US Treasury bond yields, which has helped Gold price recover lost ground. Meanwhile, Gold price continues to benefit from increased bets of smaller US Federal Reserve (Fed) rate hikes, although the US Retail Sales and Producer Price Index (PPI) will help shed more light on the same. Earlier in the day. the Bank of Japan (BoJ) stood pat on its yield control policy, which drove USD/JPY through the roof, propelling the US Dollar in tandem. Although the moves are seen reversing, as investors gear up for the high-impact US economic data.
Also read: Gold Price Forecast: XAU/USD eyes further correction toward $1,870 amid bearish technicals
The Technical Confluence Detector shows that the gold price is facing immediate resistance at $1,914, which is the Fibonacci 61.8% one-day.
A break above which will put the powerful hurdle at $1,918 under threat. That level is the convergence of the pivot point one-month R3 and pivot point one-day R1.
Acceptance above the latter is critical to extending the renewed upside toward the previous week’s high at $1,922. Further up, the nine-month top at $1,929 will challenge bearish commitments.
On the flip side, a dense cluster of healthy support levels awaits around $1,909, which is the meeting point of the Fibonacci 23.6% one-week, Fibonacci 38.2% one-day and SMA5 four-hour.
Should bears flex their muscles, then the previous day’s low at $1,903 could be put to test. The last line of defense for Gold buyers is seen at the Fibonacci 38.2% one-week at $1,899.
The TCD (Technical Confluences Detector) is a tool to locate and point out those price levels where there is a congestion of indicators, moving averages, Fibonacci levels, Pivot Points, etc. If you are a short-term trader, you will find entry points for counter-trend strategies and hunt a few points at a time. If you are a medium-to-long-term trader, this tool will allow you to know in advance the price levels where a medium-to-long-term trend may stop and rest, where to unwind positions, or where to increase your position size.
[/s2If]
Join Our Telegram Group
")


