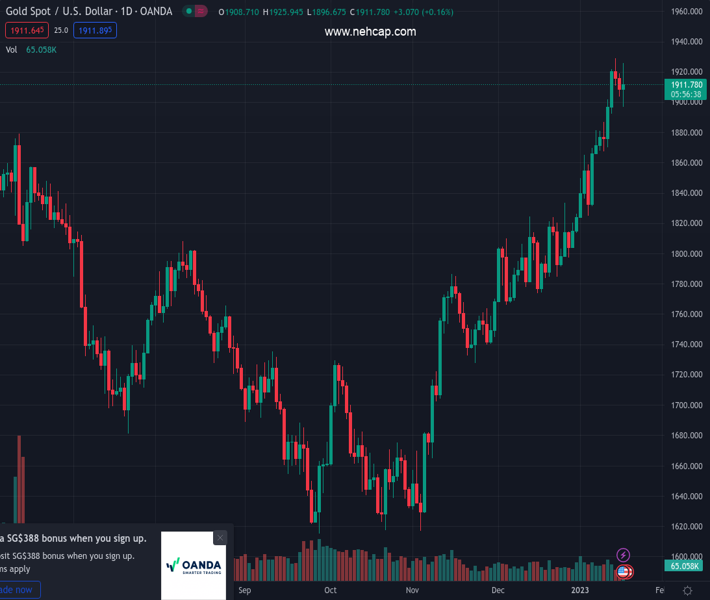
#XAUUSD @ 1,912.10 US Retail Sales plummeted, while PPI flashed that inflation continues to ease. (Pivot Orderbook analysis)
…
This is a premium post.
[s2If !current_user_can(access_s2member_level4)]Please register for PREMIUM VERSION HERE to read full post below containing analysis. In case of any error or you think you are not able to read the full post below, please email us at support#nehcap.com [lwa][/s2If] [s2If current_user_can(access_s2member_level4)]
- US Retail Sales plummeted, while PPI flashed that inflation continues to ease.
- Industrial Production in the United States shranks for two consecutive months.
- Gold Price Analysis: A daily close above $1900 is needed to exacerbate a rally to $2000.
The pair currently trades last at 1912.10.
The previous day high was 1919.16 while the previous day low was 1903.79. The daily 38.2% Fib levels comes at 1909.66, expected to provide support. Similarly, the daily 61.8% fib level is at 1913.29, expected to provide resistance.
Gold price snaps two days of straight losses, gaining traction on Wednesday, as the US Dollar (USD) slides to eight-month lows, as shown by the US Dollar Index (DXY). Data released in the United States (US) showed an improvement in inflation, while retail sales slowed a tick, further cementing the case for the US Federal Reserve (Fed) to slow down its tightening policy. At the time of writing, XAU/USD exchanges hand at $1914.91.
Wall Street opened in the green, bolstered by US data. The US Commerce Department reported that December Retail Sales plunged -1.1% MoM, below estimates of a -0.8% contraction, tumbling for two consecutive months. November figures were downward revised to -1.0% from -0.6%. Retail Sales on an annual basis rose 6%, unchanged from November’s data.
Inflation-wise, the US Producer Price Index (PPI) for December slides from -0.1% to -0.5% MoM data that could encourage the Federal Reserve to raise rates significantly higher. Excluding volatile items like food and energy, the so-called core PPI rose by 0.1% MoM, unchanged when compared to consensus and lower than November’s 0.2%. Annually based figures showed an increase of 6.2% in PPI, below estimates of 6.8%, while core PPI rose by 5.5%, beneath the 5.7% expected.
Aside from that, the Federal Reserve reported that Industrial Production in the US decreased -0.7% in December and -1.7% in Q4. Additionally, US manufacturing output fell -1.3% last month, albeit November’s data was downward revised -1.3%.
Elsewhere Fed officials began crossing newswires, led by the St. Louis Fed President James Bullard. He said the Fed should get rates above 5% “as quickly as we can” before pausing rate hikes as the US central bank tries to curb sticky inflation. Bullard added that inflation “will probably recede in 2023 but not as fast as financial markets expect.”
In the meantime, the US Dollar Index (DXY), which tracks the buck’s value against a basket of six currencies, tumbled to eight-month lows around 101.528 but lately has recovered some ground and exchanged hands around 101.871. Another reason that keeps the XAU/USD underpinned is falling US Treasury bond yields, with the 10-year benchmark note rate plunging below 3.40%, at 3.390%, as it slides 16 bps.
Technically speaking, the XAU/USD extended its gains, though retraced somewhat from its daily highs of $1925.88, probably influenced by a mild recovery of the greenback and the Relative Strength Index (RSI) entering overbought conditions. The Rate of Change (RoC) suggests that buying pressure begins to wane. If XAU/USD misses printing a daily close above $1900, that will exacerbate a resume of a downtrend toward the 20-day Exponential Moving Average at $1862.60. Otherwise, and the path of least resistance, the XAU/USD might test the YTD high at $1928.95, followed by the April 21 high of $1957.72, ahead of the $2000 mark.
Technical Levels: Supports and Resistances
XAUUSD currently trading at 1916.55 at the time of writing. Pair opened at 1909.19 and is trading with a change of 0.39 % .
| Overview | Overview.1 | |
|---|---|---|
| 0 | Today last price | 1916.55 |
| 1 | Today Daily Change | 7.36 |
| 2 | Today Daily Change % | 0.39 |
| 3 | Today daily open | 1909.19 |
The pair remains strongly bullish on the daily timeframe. It trades above its 20 SMA @ 1847.16, 50 SMA 1801.78, 100 SMA @ 1737.71 and 200 SMA @ 1776.73.
| Trends | Trends.1 | |
|---|---|---|
| 0 | Daily SMA20 | 1847.16 |
| 1 | Daily SMA50 | 1801.78 |
| 2 | Daily SMA100 | 1737.71 |
| 3 | Daily SMA200 | 1776.73 |
The previous day high was 1919.16 while the previous day low was 1903.79. The daily 38.2% Fib levels comes at 1909.66, expected to provide support. Similarly, the daily 61.8% fib level is at 1913.29, expected to provide resistance.
Note the levels of interest below:
- Pivot support is noted at 1902.27, 1895.34, 1886.9
- Pivot resistance is noted at 1917.64, 1926.08, 1933.01
| Levels | Levels.1 |
|---|---|
| Previous Daily High | 1919.16 |
| Previous Daily Low | 1903.79 |
| Previous Weekly High | 1921.96 |
| Previous Weekly Low | 1865.22 |
| Previous Monthly High | 1833.38 |
| Previous Monthly Low | 1765.89 |
| Daily Fibonacci 38.2% | 1909.66 |
| Daily Fibonacci 61.8% | 1913.29 |
| Daily Pivot Point S1 | 1902.27 |
| Daily Pivot Point S2 | 1895.34 |
| Daily Pivot Point S3 | 1886.90 |
| Daily Pivot Point R1 | 1917.64 |
| Daily Pivot Point R2 | 1926.08 |
| Daily Pivot Point R3 | 1933.01 |
[/s2If]
Join Our Telegram Group
")


