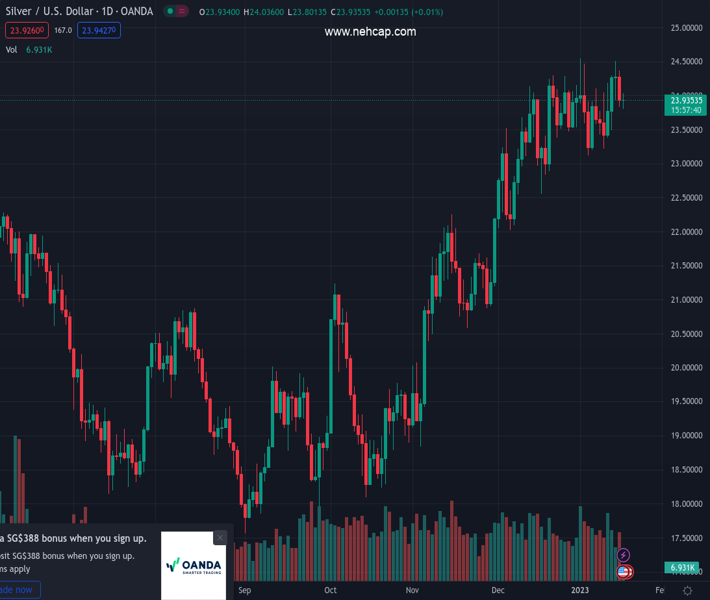
#XAGUSD @ 23.931 Silver attempts a modest recovery from the weekly low touched earlier this Wednesday. (Pivot Orderbook analysis)
…
This is a premium post.
[s2If !current_user_can(access_s2member_level4)]Please register for PREMIUM VERSION HERE to read full post below containing analysis. In case of any error or you think you are not able to read the full post below, please email us at support#nehcap.com [lwa][/s2If] [s2If current_user_can(access_s2member_level4)]
- Silver attempts a modest recovery from the weekly low touched earlier this Wednesday.
- Mixed oscillators setup warrants some caution before placing aggressive directional bets.
- A convincing break below channel support is needed to support prospects further losses.
The pair currently trades last at 23.931.
The previous day high was 24.37 while the previous day low was 23.83. The daily 38.2% Fib levels comes at 24.04, expected to provide resistance. Similarly, the daily 61.8% fib level is at 24.17, expected to provide resistance.
Silver bounces off the weekly low touched during the Asian session on Wednesday and is currently placed in neutral territory, just below the $24.00 round-figure mark.
From a technical perspective, the recent price action witnessed over the past month or so constitutes the formation of an ascending channel, pointing to a short-term bullish trend. Moreover, the XAG/USD, so far, has managed to hold its neck comfortably above the 200-period SMA on the 4-hour chart. This, in turn, favours bullish traders and supports prospects for additional near-term gains.
That said, oscillators on the daily chart have been losing traction and have just started drifting in the negative territory on the 4-hour chart. Hence, any intraday move-up is more likely to confront some resistance near the $24.30 area, which is followed by the multi-month peak, around the $24.50 area. Bulls might wait for sustained strength beyond the said barriers before placing fresh bets.
The XAG/USD might then climb towards challenging the top end of the aforementioned trend channel, currently around the $24.80-$24.85 region. Some follow-through buying beyond the $25.00 psychological mark will mark a fresh breakout and pave the way for a further near-term appreciating move. This, in turn, could lift the white metal to the next relevant hurdle near the $25.35-$25.40 zone.
On the flip side, the 200-period SMA on the 4-hour chart, currently around the $23.45 region, is likely to protect the immediate downside ahead of the trend-channel support, near the $23.30-$23.25 area. A convincing break below the latter might turn the XAG/USD vulnerable to weaken further below the $23.00 mark and fall to the $22.60-$22.55 support en route to the $22.10-$22.00 region.
Technical Levels: Supports and Resistances
XAGUSD currently trading at 23.93 at the time of writing. Pair opened at 23.93 and is trading with a change of 0.0 % .
| Overview | Overview.1 | |
|---|---|---|
| 0 | Today last price | 23.93 |
| 1 | Today Daily Change | 0.00 |
| 2 | Today Daily Change % | 0.00 |
| 3 | Today daily open | 23.93 |
The pair remains strongly bullish on the daily timeframe. It trades above its 20 SMA @ 23.8, 50 SMA 22.84, 100 SMA @ 21.05 and 200 SMA @ 21.07.
| Trends | Trends.1 | |
|---|---|---|
| 0 | Daily SMA20 | 23.80 |
| 1 | Daily SMA50 | 22.84 |
| 2 | Daily SMA100 | 21.05 |
| 3 | Daily SMA200 | 21.07 |
The previous day high was 24.37 while the previous day low was 23.83. The daily 38.2% Fib levels comes at 24.04, expected to provide resistance. Similarly, the daily 61.8% fib level is at 24.17, expected to provide resistance.
Note the levels of interest below:
- Pivot support is noted at 23.72, 23.5, 23.17
- Pivot resistance is noted at 24.26, 24.59, 24.8
| Levels | Levels.1 |
|---|---|
| Previous Daily High | 24.37 |
| Previous Daily Low | 23.83 |
| Previous Weekly High | 24.30 |
| Previous Weekly Low | 23.22 |
| Previous Monthly High | 24.30 |
| Previous Monthly Low | 22.03 |
| Daily Fibonacci 38.2% | 24.04 |
| Daily Fibonacci 61.8% | 24.17 |
| Daily Pivot Point S1 | 23.72 |
| Daily Pivot Point S2 | 23.50 |
| Daily Pivot Point S3 | 23.17 |
| Daily Pivot Point R1 | 24.26 |
| Daily Pivot Point R2 | 24.59 |
| Daily Pivot Point R3 | 24.80 |
[/s2If]
Join Our Telegram Group
")


