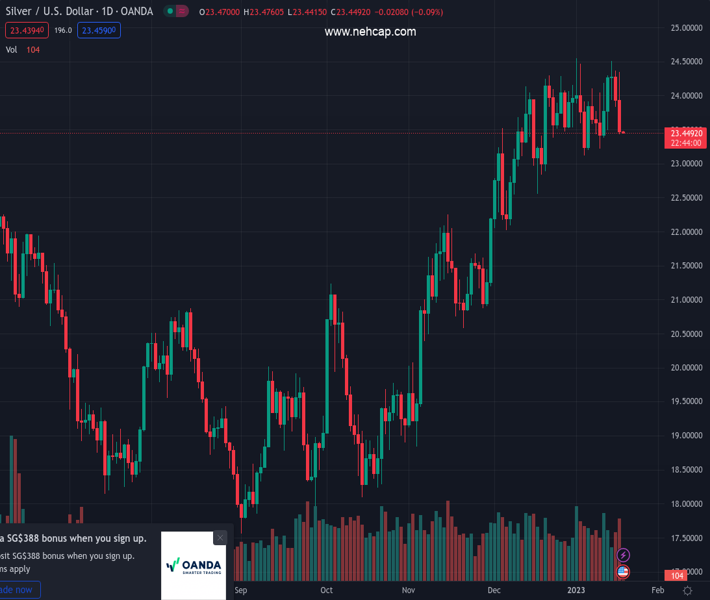
#XAGUSD @ 23.439 Silver extended its losses to two-consecutive days, down by 1.97% on Wednesday. (Pivot Orderbook analysis)
…
This is a premium post.
[s2If !current_user_can(access_s2member_level4)]Please register for PREMIUM VERSION HERE to read full post below containing analysis. In case of any error or you think you are not able to read the full post below, please email us at support#nehcap.com [lwa][/s2If] [s2If current_user_can(access_s2member_level4)]
- Silver extended its losses to two-consecutive days, down by 1.97% on Wednesday.
- From a daily chart perspective, the XAG/USD is neutral to upward biased but needs to hold prices above $23.00 to extend its gains.
- XAG/USD Price Analysis: Neutral-to-downward biased, and once it clears $23.00, that could expose Silver to lower prices.
The pair currently trades last at 23.439.
The previous day high was 24.37 while the previous day low was 23.83. The daily 38.2% Fib levels comes at 24.04, expected to provide resistance. Similarly, the daily 61.8% fib level is at 24.17, expected to provide resistance.
Silver price plummeted for the second straight day, extending its losses below $23.50 on Wednesday, as late US Dollar (USD) strength erased the greenback losses in the day, a headwind for the white metal. At the time of writing, the XAG/USD is trading at $23.45, below its opening price by 1.97%.
The XAG/USD daily chart suggests Silver is neutral-to-upward biased. Even though the pullback cleared the 20-day Exponential Moving Average (EMA), a decisive break below the January 5 daily low of $23.12 is needed to shift the bias to neutral; additionally, it will expose the 50-day EMA at $22.86. Oscillators like the Relative Strength Index (RSI) suggest that sellers are beginning to gather momentum, so the last line of defense for XAG/USD buyers would be $23.00.
Analyzing Silver from an intraday perspective, the XAG/USD 4-hour chart portrays the pair as neutral-to-downward biased, as the Exponential Moving Averages (EMAs) reside above XAG/USD price. However, to further extend its downtrend, the white metal needs to clear the 200-EMA at $23.33, which, once cleared, could open the door for further losses. Therefore, the XAG/USD first support would be the January 5 swing low at $23.22. Once cleared, it would expose the December 19 daily low of $23.10, followed by the December 16 pivot low at $22.52.
Technical Levels: Supports and Resistances
XAGUSD currently trading at 23.47 at the time of writing. Pair opened at 23.93 and is trading with a change of -1.92 % .
| Overview | Overview.1 | |
|---|---|---|
| 0 | Today last price | 23.47 |
| 1 | Today Daily Change | -0.46 |
| 2 | Today Daily Change % | -1.92 |
| 3 | Today daily open | 23.93 |
The pair is trading below its 20 Daily moving average @ 23.8, above its 50 Daily moving average @ 22.84 , above its 100 Daily moving average @ 21.05 and above its 200 Daily moving average @ 21.07
| Trends | Trends.1 | |
|---|---|---|
| 0 | Daily SMA20 | 23.80 |
| 1 | Daily SMA50 | 22.84 |
| 2 | Daily SMA100 | 21.05 |
| 3 | Daily SMA200 | 21.07 |
The previous day high was 24.37 while the previous day low was 23.83. The daily 38.2% Fib levels comes at 24.04, expected to provide resistance. Similarly, the daily 61.8% fib level is at 24.17, expected to provide resistance.
Note the levels of interest below:
- Pivot support is noted at 23.72, 23.5, 23.17
- Pivot resistance is noted at 24.26, 24.59, 24.8
| Levels | Levels.1 |
|---|---|
| Previous Daily High | 24.37 |
| Previous Daily Low | 23.83 |
| Previous Weekly High | 24.30 |
| Previous Weekly Low | 23.22 |
| Previous Monthly High | 24.30 |
| Previous Monthly Low | 22.03 |
| Daily Fibonacci 38.2% | 24.04 |
| Daily Fibonacci 61.8% | 24.17 |
| Daily Pivot Point S1 | 23.72 |
| Daily Pivot Point S2 | 23.50 |
| Daily Pivot Point S3 | 23.17 |
| Daily Pivot Point R1 | 24.26 |
| Daily Pivot Point R2 | 24.59 |
| Daily Pivot Point R3 | 24.80 |
[/s2If]
Join Our Telegram Group
")


