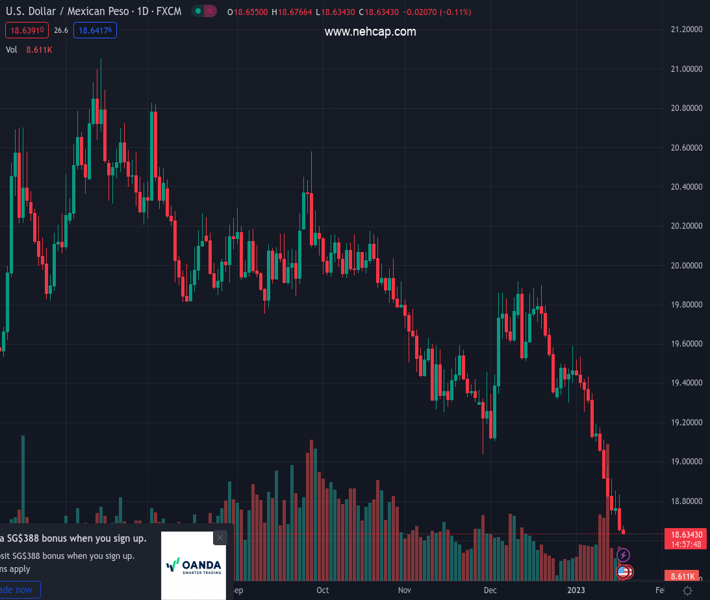
#USDMXN @ 18.6415 bears poke the 2020’s yearly low during three-week losing streak., @nehcap view: Limited downside expected (Pivot Orderbook analysis)
…
This is a premium post.
[s2If !current_user_can(access_s2member_level4)]Please register for PREMIUM VERSION HERE to read full post below containing analysis. In case of any error or you think you are not able to read the full post below, please email us at support#nehcap.com [lwa][/s2If] [s2If current_user_can(access_s2member_level4)]
- USD/MXN bears poke the 2020’s yearly low during three-week losing streak.
- Clear downside break of multi-month-old support line, bearish MACD signals favor sellers.
- Oversold RSI conditions suggest limited downside room before a corrective bounce.
The pair currently trades last at 18.6415.
The previous day high was 18.8343 while the previous day low was 18.6649. The daily 38.2% Fib levels comes at 18.7296, expected to provide resistance. Similarly, the daily 61.8% fib level is at 18.7696, expected to provide resistance.
USD/MXN stands on slippery grounds as bears keep the reins for the third consecutive week, down 0.14% intraday around 18.65 by the press time of early Wednesday in Europe.
In doing so, the Mexican Peso (MXN) pair extends the previous day’s losses to drop to the lowest levels since February 2020.
The quote’s bearish trajectory could be linked to the downside break of the previous key support line from July 2017, now resistance around 19.73. Also keeping the pair sellers hopeful is the USD/MXN’s pullback from the 21-SMA, close to 19.62 at the latest. Furthermore, bearish MACD signals are extra positives for selling the pair.
However, the oversold RSI (14) line and nearness to the key support, namely the year 2020’s low of 18.52, hints at limited downside room for the USD/MXN bears to cheer.
In a case where the pair drops below 18.52 support, a slump toward 2017’s bottom of 17.44 can’t be ruled out.
Meanwhile, an upside clearance of the 21-SMA level of 19.62 will need validation from the 61.8% Fibonacci retracement level of the pair’s run-up from July 2017 to April 2020, close to 20.65, to convince USD/MXN buyers. That said, the 20.00 round figure could also challenge the pair’s recovery.
Trend: Limited downside expected
Technical Levels: Supports and Resistances
USDMXN currently trading at 18.6482 at the time of writing. Pair opened at 18.6733 and is trading with a change of -0.13% % .
| Overview | Overview.1 | |
|---|---|---|
| 0 | Today last price | 18.6482 |
| 1 | Today Daily Change | -0.0251 |
| 2 | Today Daily Change % | -0.13% |
| 3 | Today daily open | 18.6733 |
The pair remains strongly bearish on the daily time frame. It trades below the 20 SMA @ 19.2377, 50 SMA 19.404, 100 SMA @ 19.6887 and 200 SMA @ 19.9253.
| Trends | Trends.1 | |
|---|---|---|
| 0 | Daily SMA20 | 19.2377 |
| 1 | Daily SMA50 | 19.4040 |
| 2 | Daily SMA100 | 19.6887 |
| 3 | Daily SMA200 | 19.9253 |
The previous day high was 18.8343 while the previous day low was 18.6649. The daily 38.2% Fib levels comes at 18.7296, expected to provide resistance. Similarly, the daily 61.8% fib level is at 18.7696, expected to provide resistance.
Note the levels of interest below:
- Pivot support is noted at 18.6141, 18.5548, 18.4447
- Pivot resistance is noted at 18.7835, 18.8936, 18.9528
| Levels | Levels.1 |
|---|---|
| Previous Daily High | 18.8343 |
| Previous Daily Low | 18.6649 |
| Previous Weekly High | 19.1951 |
| Previous Weekly Low | 18.7331 |
| Previous Monthly High | 19.9181 |
| Previous Monthly Low | 19.1084 |
| Daily Fibonacci 38.2% | 18.7296 |
| Daily Fibonacci 61.8% | 18.7696 |
| Daily Pivot Point S1 | 18.6141 |
| Daily Pivot Point S2 | 18.5548 |
| Daily Pivot Point S3 | 18.4447 |
| Daily Pivot Point R1 | 18.7835 |
| Daily Pivot Point R2 | 18.8936 |
| Daily Pivot Point R3 | 18.9528 |
[/s2If]
Join Our Telegram Group
")


