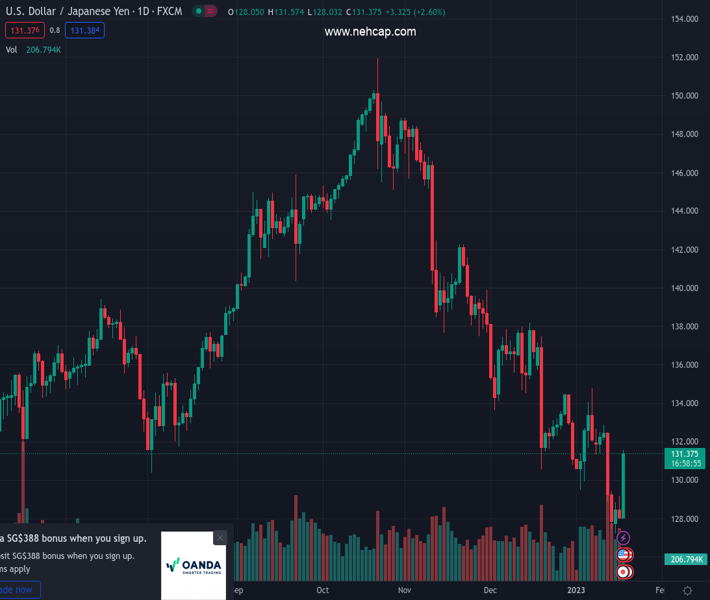
#USDJPY @ 131.341 is struggling to extend its storm further above the prior auction area in a 131.38-132.93 range. (Pivot Orderbook analysis)
…
This is a premium post.
[s2If !current_user_can(access_s2member_level4)]Please register for PREMIUM VERSION HERE to read full post below containing analysis. In case of any error or you think you are not able to read the full post below, please email us at support#nehcap.com [lwa][/s2If] [s2If current_user_can(access_s2member_level4)]
- USD/JPY is struggling to extend its storm further above the prior auction area in a 131.38-132.93 range.
- The asset has conquered the 200-EMA swiftly post unchanged monetary policy by the BoJ.
- The US Dollar Index (DXY) has surpassed 102.40 after delivering a breakout above 102.20 resistance.
The pair currently trades last at 131.341.
The previous day high was 129.16 while the previous day low was 127.99. The daily 38.2% Fib levels comes at 128.44, expected to provide support. Similarly, the daily 61.8% fib level is at 128.72, expected to provide support.
The USD/JPY pair is continuously driving vertically, showing no mercy to intermediate resistances amid weakness in the Japanese Yen after the announcement of the unchanged monetary policy by the Bank of Japan (BoJ). The major has recorded an intraday high of 131.50 as BoJ Governor Haruhiko Kuroda has kept the interest rate steady at -0.10% and the 10-year Japanese Government Bonds (JGBs) around 0%.
An unchanged monetary policy has created ambiguity among the market participants. Investors were also expecting that the BoJ might dismantle the extended target of yield curve control as it demand massive bond-buying for defending the cap, as reported by Reuters.
The US Dollar Index (DXY) has scaled sharply above 102.40 after delivering a breakout of the crucial resistance at around 102.20. S&P500 futures have turned positive after a subdued performance in early Asia, portraying sheer volatility in the market.
USD/JPY is struggling to extend its storm after reaching the previous auction area placed in a range of 131.38-132.93 on an hourly scale. The asset has conquered the 200-period Exponential Moving Average (EMA) at 130.13 comfortably, which indicates that the long-term trend is super-bullish now.
A range shift into the bullish territory of 60.00-80.00 by the RSI (14) is indicating that the upside momentum is active.
For further upside, the asset needs to settle above the aforementioned auction area in a 131.38-132.93 range, which will drive the asset towards January 6 high at 134.77 followed by December 19 low around 136.00.
On the flip side, a decisive drop below Monday’s low at 127.22, will expose the asset for more downside towards the horizontal support plotted from May 24 low at 126.36. A slippage below the latter will open room for further downside toward the psychological support at 125.00.
Technical Levels: Supports and Resistances
USDJPY currently trading at 131.39 at the time of writing. Pair opened at 128.21 and is trading with a change of 2.48 % .
| Overview | Overview.1 | |
|---|---|---|
| 0 | Today last price | 131.39 |
| 1 | Today Daily Change | 3.18 |
| 2 | Today Daily Change % | 2.48 |
| 3 | Today daily open | 128.21 |
The pair remains strongly bearish on the daily time frame. It trades below the 20 SMA @ 131.65, 50 SMA 135.59, 100 SMA @ 140.42 and 200 SMA @ 136.67.
| Trends | Trends.1 | |
|---|---|---|
| 0 | Daily SMA20 | 131.65 |
| 1 | Daily SMA50 | 135.59 |
| 2 | Daily SMA100 | 140.42 |
| 3 | Daily SMA200 | 136.67 |
The previous day high was 129.16 while the previous day low was 127.99. The daily 38.2% Fib levels comes at 128.44, expected to provide support. Similarly, the daily 61.8% fib level is at 128.72, expected to provide support.
Note the levels of interest below:
- Pivot support is noted at 127.75, 127.28, 126.58
- Pivot resistance is noted at 128.92, 129.63, 130.09
| Levels | Levels.1 |
|---|---|
| Previous Daily High | 129.16 |
| Previous Daily Low | 127.99 |
| Previous Weekly High | 132.87 |
| Previous Weekly Low | 127.46 |
| Previous Monthly High | 138.18 |
| Previous Monthly Low | 130.57 |
| Daily Fibonacci 38.2% | 128.44 |
| Daily Fibonacci 61.8% | 128.72 |
| Daily Pivot Point S1 | 127.75 |
| Daily Pivot Point S2 | 127.28 |
| Daily Pivot Point S3 | 126.58 |
| Daily Pivot Point R1 | 128.92 |
| Daily Pivot Point R2 | 129.63 |
| Daily Pivot Point R3 | 130.09 |
[/s2If]
Join Our Telegram Group
")


