#USDJPY @ 128.463 trims some of its Asian session gains courtesy of the Bank of Japan’s decision. (Pivot Orderbook analysis)
…
This is a premium post.
[s2If !current_user_can(access_s2member_level4)]Please register for PREMIUM VERSION HERE to read full post below containing analysis. In case of any error or you think you are not able to read the full post below, please email us at support#nehcap.com [lwa][/s2If] [s2If current_user_can(access_s2member_level4)]
- USD/JPY trims some of its Asian session gains courtesy of the Bank of Japan’s decision.
- USD/JPY Price Analysis: Failure to conquer the 20-day EMA exacerbated a 200-plus pip fall beneath 128.50.
The pair currently trades last at 128.463.
The previous day high was 129.16 while the previous day low was 127.99. The daily 38.2% Fib levels comes at 128.44, expected to provide support. Similarly, the daily 61.8% fib level is at 128.72, expected to provide resistance.
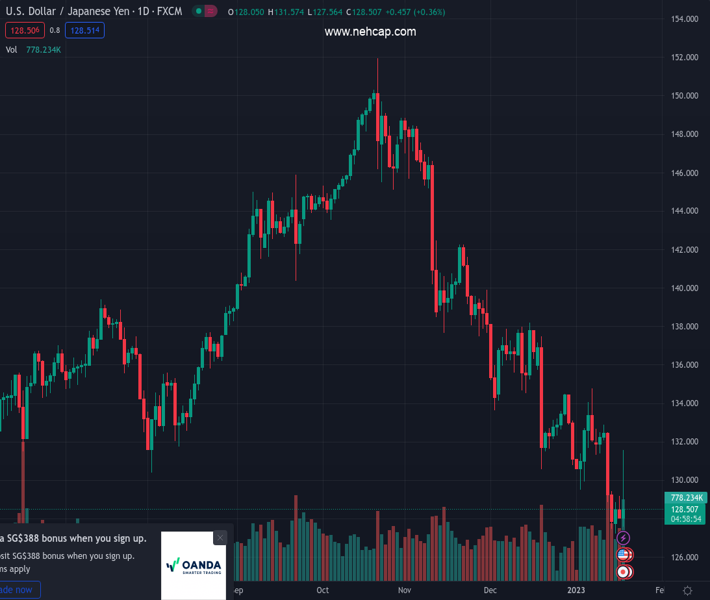
The USD/JPY clings to gains after hitting a daily high of 131.57 following the release of the Bank of Japan’s (BoJ) monetary policy decision, which sparked a 400 pip rally. However, throughout the North American session, the Japanese Yen (JPY) stages a comeback against its counterpart, the US Dollar (USD), and so far is down 0.24%. At the time of writing, the USD/JPY is trading at 128.56.
The USD/JPY daily chart portrays the major tested the confluence of the 20-day Exponential Moving Average (EMA) and the day’s high at 131.37 and failed to sustain the uptrend. Furthermore, on its way down, the USD/JPY retraced below a four-month downslope resistance trendline that passed around 130.30 ad extended its downtrend beneath 129.00 toward the current spot price.
However, oscillators like the Relative Strength Index (RSI although at bearish territory, its slope aims up, which could mean a reversal could happen. But the Rate of Change (Roc) suggests buyers are losing momentum as it retraces to the zero level.
The path of least resistance in the USD/JPY is downward biased, though if the USD/JPY prints a daily close above 128.46, that could open the door for further upside and might test the 129.00 mark. Otherwise, the USD/JPY first support would be 128.00. A breach of the latter will expose the May 24 swing low of 126.36, followed by the March 31 daily low of 121.27.
Technical Levels: Supports and Resistances
USDJPY currently trading at 128.6 at the time of writing. Pair opened at 128.21 and is trading with a change of 0.3 % .
| Overview | Overview.1 | |
|---|---|---|
| 0 | Today last price | 128.60 |
| 1 | Today Daily Change | 0.39 |
| 2 | Today Daily Change % | 0.30 |
| 3 | Today daily open | 128.21 |
The pair remains strongly bearish on the daily time frame. It trades below the 20 SMA @ 131.65, 50 SMA 135.59, 100 SMA @ 140.42 and 200 SMA @ 136.67.
| Trends | Trends.1 | |
|---|---|---|
| 0 | Daily SMA20 | 131.65 |
| 1 | Daily SMA50 | 135.59 |
| 2 | Daily SMA100 | 140.42 |
| 3 | Daily SMA200 | 136.67 |
The previous day high was 129.16 while the previous day low was 127.99. The daily 38.2% Fib levels comes at 128.44, expected to provide support. Similarly, the daily 61.8% fib level is at 128.72, expected to provide resistance.
Note the levels of interest below:
- Pivot support is noted at 127.75, 127.28, 126.58
- Pivot resistance is noted at 128.92, 129.63, 130.09
| Levels | Levels.1 |
|---|---|
| Previous Daily High | 129.16 |
| Previous Daily Low | 127.99 |
| Previous Weekly High | 132.87 |
| Previous Weekly Low | 127.46 |
| Previous Monthly High | 138.18 |
| Previous Monthly Low | 130.57 |
| Daily Fibonacci 38.2% | 128.44 |
| Daily Fibonacci 61.8% | 128.72 |
| Daily Pivot Point S1 | 127.75 |
| Daily Pivot Point S2 | 127.28 |
| Daily Pivot Point S3 | 126.58 |
| Daily Pivot Point R1 | 128.92 |
| Daily Pivot Point R2 | 129.63 |
| Daily Pivot Point R3 | 130.09 |
[/s2If]
Join Our Telegram Group
")


