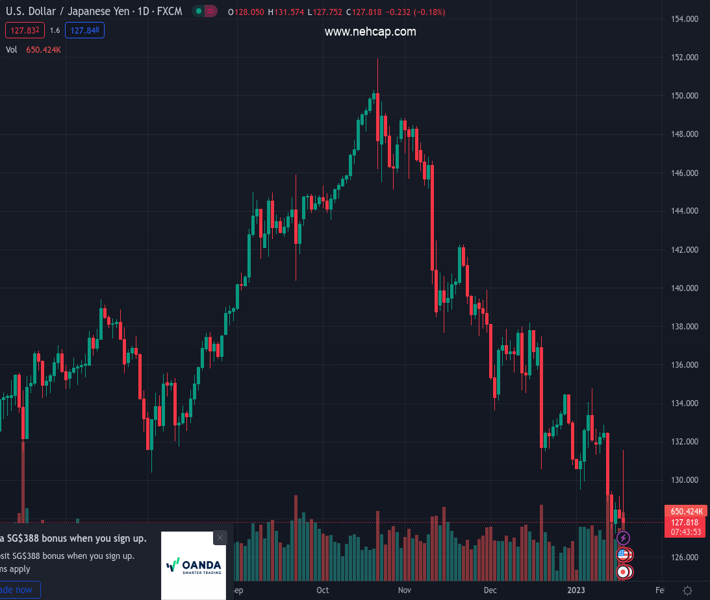
#USDJPY @ 128.146 retreats over 350 pips from the daily low amid aggressive intraday USD selling. (Pivot Orderbook analysis)
…
This is a premium post.
[s2If !current_user_can(access_s2member_level4)]Please register for PREMIUM VERSION HERE to read full post below containing analysis. In case of any error or you think you are not able to read the full post below, please email us at support#nehcap.com [lwa][/s2If] [s2If current_user_can(access_s2member_level4)]
- USD/JPY retreats over 350 pips from the daily low amid aggressive intraday USD selling.
- The USD adds to its losses following the release of weaker-than-expected US macro data.
- A positive risk tone might undermine the safe-haven JPY and help limit losses for the pair.
The pair currently trades last at 128.146.
The previous day high was 129.16 while the previous day low was 127.99. The daily 38.2% Fib levels comes at 128.44, expected to provide resistance. Similarly, the daily 61.8% fib level is at 128.72, expected to provide resistance.
The USD/JPY pair surrenders its intraday gains that followed the Bank of Japan policy decision and retreats to the lower end of its daily range during the early North American session. The pair is currently placed around the 128.00 mark and has now moved well within the striking distance of its lowest level since May 2022 touched earlier this week.
As investors digest the BoJ’s dovish stance, the emergence of aggressive US Dollar selling turns out to be a key factor leading to the USD/JPY pair’s sharp intraday fall of over 350 pips. The USD adds to its heavy losses and drops to a seven-month low following the release of softer-than-expected US macro data, which boosted bets for smaller rate hikes by the Federal Reserve.
Data published by the US Bureau of Labor Statistics showed that the Producer Price Index (PPI) declined to the 6.2% YoY rate in December. This was well below consensus estimates for a fall to 6.8% from November’s downwardly revised reading of 7.3%. The data further points to easing inflationary pressure, which could allow the Fed to slow the pace of its policy tightening.
The US monthly Retail Sales also fell short of market expectations and declined by 1.1% MoM in December, missing estimates for a 0.8% fall. Excluding autos, core retail sales also contracted by 1.1% during the reported month as compared to a 0.4% drop anticipated, suggesting a slowdown in consumer demand and reaffirming expectations that the Fed will soften its hawkish stance.
This, in turn, leads to a further decline in the US Treasury bond yields, which continues to weigh on the greenback. That said, a generally positive tone around the equity markets seems to undermine the safe-haven Japanese Yen. This might hold back traders from placing fresh bearish bets around the USD/JPY pair and help limit the downside, at least for the time being.
Technical Levels: Supports and Resistances
USDJPY currently trading at 128.12 at the time of writing. Pair opened at 128.21 and is trading with a change of -0.07 % .
| Overview | Overview.1 | |
|---|---|---|
| 0 | Today last price | 128.12 |
| 1 | Today Daily Change | -0.09 |
| 2 | Today Daily Change % | -0.07 |
| 3 | Today daily open | 128.21 |
The pair remains strongly bearish on the daily time frame. It trades below the 20 SMA @ 131.65, 50 SMA 135.59, 100 SMA @ 140.42 and 200 SMA @ 136.67.
| Trends | Trends.1 | |
|---|---|---|
| 0 | Daily SMA20 | 131.65 |
| 1 | Daily SMA50 | 135.59 |
| 2 | Daily SMA100 | 140.42 |
| 3 | Daily SMA200 | 136.67 |
The previous day high was 129.16 while the previous day low was 127.99. The daily 38.2% Fib levels comes at 128.44, expected to provide resistance. Similarly, the daily 61.8% fib level is at 128.72, expected to provide resistance.
Note the levels of interest below:
- Pivot support is noted at 127.75, 127.28, 126.58
- Pivot resistance is noted at 128.92, 129.63, 130.09
| Levels | Levels.1 |
|---|---|
| Previous Daily High | 129.16 |
| Previous Daily Low | 127.99 |
| Previous Weekly High | 132.87 |
| Previous Weekly Low | 127.46 |
| Previous Monthly High | 138.18 |
| Previous Monthly Low | 130.57 |
| Daily Fibonacci 38.2% | 128.44 |
| Daily Fibonacci 61.8% | 128.72 |
| Daily Pivot Point S1 | 127.75 |
| Daily Pivot Point S2 | 127.28 |
| Daily Pivot Point S3 | 126.58 |
| Daily Pivot Point R1 | 128.92 |
| Daily Pivot Point R2 | 129.63 |
| Daily Pivot Point R3 | 130.09 |
[/s2If]
Join Our Telegram Group
")


