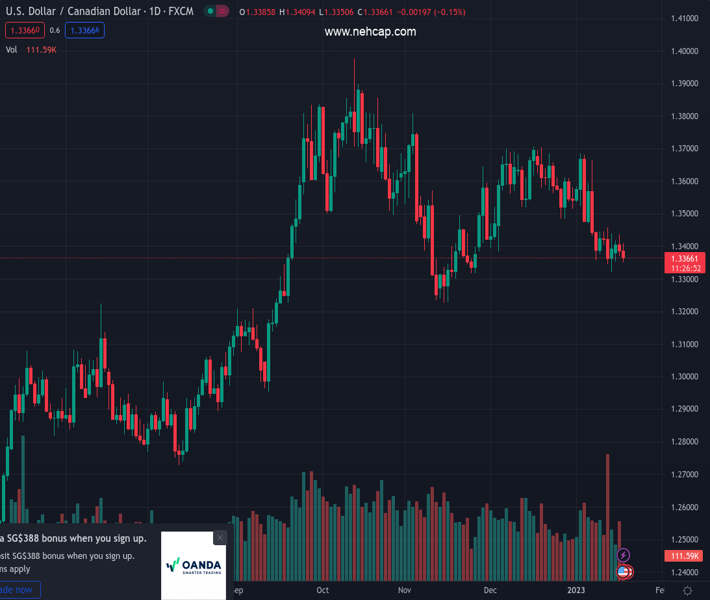
#USDCAD @ 1.33697 turns lower for the second straight day and is pressured by a combination of factors. (Pivot Orderbook analysis)
…
This is a premium post.
[s2If !current_user_can(access_s2member_level4)]Please register for PREMIUM VERSION HERE to read full post below containing analysis. In case of any error or you think you are not able to read the full post below, please email us at support#nehcap.com [lwa][/s2If] [s2If current_user_can(access_s2member_level4)]
- USD/CAD turns lower for the second straight day and is pressured by a combination of factors.
- Bullish crude oil prices underpin the Loonie and weigh on the pair amid renewed USD selling.
- Traders now look forward to the US PPI and Retail Sales data for short-term opportunities.
The pair currently trades last at 1.33697.
The previous day high was 1.3437 while the previous day low was 1.3369. The daily 38.2% Fib levels comes at 1.3395, expected to provide resistance. Similarly, the daily 61.8% fib level is at 1.3411, expected to provide resistance.
The USD/CAD pair attracts fresh selling on Wednesday following an early uptick to the 1.3410 area and turns lower for the second successive day. The steady intraday descent drags spot prices to a fresh weekly low, around mid-1.3300s, during the first half of the European session and is sponsored by a combination of factors.
Crude oil prices climb to the highest level since early December amid the optimism that the easing of strict COVID-19 curbs in China will boost fuel demand. This, in turn, underpins the commodity-linked Loonie, which, along with the emergence of heavy intraday selling around the US Dollar, exerts some downward pressure on the USD/CAD pair.
In fact, the USD Index, which tracks the greenback’s performance against a basket of currencies, fails to preserve its strong intraday gains amid bets for a less aggressive policy tightening by the Fed. The markets now seem convinced that the Fed will soften its stance and have been pricing in a smaller 25 bps rate hike in February.
The bets were reaffirmed by the US CPI report released last week, which pointed to signs of easing inflationary pressure. This led to a fresh leg down in the US Treasury bond yields and is seen weighing heavily on the greenback, dragging the USD/CAD pair back closer to its lowest level since November 25 touched on Friday.
Market participants now look to the US economic docket, highlighting the release of the Producer Price Index and monthly Retail Sales later during the early North American session. This, along with speeches by influential FOMC members, the US bond yields and the broader market risk sentiment, will drive the USD demand.
Apart from this, traders will take cues from oil price dynamics to grab short-term opportunities around the USD/CAD pair. Nevertheless, the fundamental backdrop seems tilted in favour of bears and suggests that the path of least resistance for spot prices is to the downside. Hence, any attempted recovery could get sold into.
Technical Levels: Supports and Resistances
USDCAD currently trading at 1.3358 at the time of writing. Pair opened at 1.3388 and is trading with a change of -0.22 % .
| Overview | Overview.1 | |
|---|---|---|
| 0 | Today last price | 1.3358 |
| 1 | Today Daily Change | -0.0030 |
| 2 | Today Daily Change % | -0.2200 |
| 3 | Today daily open | 1.3388 |
The pair is trading below its 20 Daily moving average @ 1.351, below its 50 Daily moving average @ 1.3495 , below its 100 Daily moving average @ 1.3503 and above its 200 Daily moving average @ 1.3177
| Trends | Trends.1 | |
|---|---|---|
| 0 | Daily SMA20 | 1.3510 |
| 1 | Daily SMA50 | 1.3495 |
| 2 | Daily SMA100 | 1.3503 |
| 3 | Daily SMA200 | 1.3177 |
The previous day high was 1.3437 while the previous day low was 1.3369. The daily 38.2% Fib levels comes at 1.3395, expected to provide resistance. Similarly, the daily 61.8% fib level is at 1.3411, expected to provide resistance.
Note the levels of interest below:
- Pivot support is noted at 1.3359, 1.333, 1.3291
- Pivot resistance is noted at 1.3427, 1.3466, 1.3494
| Levels | Levels.1 |
|---|---|
| Previous Daily High | 1.3437 |
| Previous Daily Low | 1.3369 |
| Previous Weekly High | 1.3461 |
| Previous Weekly Low | 1.3322 |
| Previous Monthly High | 1.3705 |
| Previous Monthly Low | 1.3385 |
| Daily Fibonacci 38.2% | 1.3395 |
| Daily Fibonacci 61.8% | 1.3411 |
| Daily Pivot Point S1 | 1.3359 |
| Daily Pivot Point S2 | 1.3330 |
| Daily Pivot Point S3 | 1.3291 |
| Daily Pivot Point R1 | 1.3427 |
| Daily Pivot Point R2 | 1.3466 |
| Daily Pivot Point R3 | 1.3494 |
[/s2If]
Join Our Telegram Group
")


