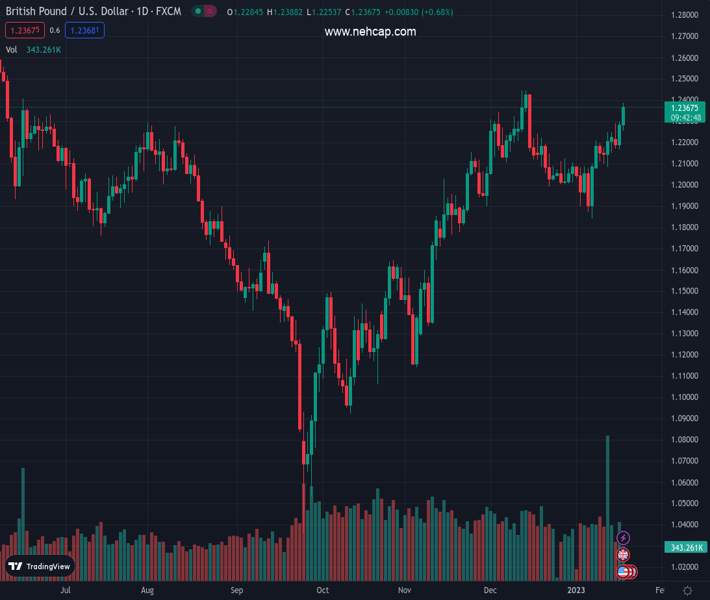
#GBPUSD @ 1.23707 climbs to over a one-month high and draws support from a combination of factors. (Pivot Orderbook analysis)
…
This is a premium post.
[s2If !current_user_can(access_s2member_level4)]Please register for PREMIUM VERSION HERE to read full post below containing analysis. In case of any error or you think you are not able to read the full post below, please email us at support#nehcap.com [lwa][/s2If] [s2If current_user_can(access_s2member_level4)]
- GBP/USD climbs to over a one-month high and draws support from a combination of factors.
- Elevated UK CPI might force the BoE to continue raising rates and boost the British Pound.
- Bets for smaller Fed rate hikes, sliding US bond yields weigh on the USD and extend support.
- Traders now look forward to important US economic data for some short-term opportunities.
The pair currently trades last at 1.23707.
The previous day high was 1.23 while the previous day low was 1.2169. The daily 38.2% Fib levels comes at 1.225, expected to provide support. Similarly, the daily 61.8% fib level is at 1.2219, expected to provide support.
The GBP/USD pair gains positive traction for the second successive day on Wednesday and scales higher through the mid-European session. Spot prices climb to the highest level since mid-December, around the 1.2360-1.2365 region in the last hour and seem poised to prolong the ascending trend witnessed over the past two weeks or so.
The British Pound strengths following the release of the UK consumer inflation figures, which remain elevated and could maintain pressure on the Bank of England (BoE) to continue raising interest rates. The UK Office for National Statistics reported that the annual CPI fell to a three-month low level of 10.5% in December, though the core reading stayed at 6.3% or more than three times the BoE’s 2% target. Apart from this, the emergence of heavy selling around the US Dollar provides an additional boost to the GBP/USD pair.
Firming expectations for a less aggressive policy tightening by the Fed triggers a fresh leg down in the US Treasury bond yields. In fact, the markets now seem convinced that the US central bank will soften its hawkish stance amid signs of easing inflationary pressures and have been pricing in a 25 bps rate hike in February. This, along with a generally positive risk tone – amid hopes for a strong economic recovery in China – further dents the Greenback’s relative safe-haven status against its British counterpart.
Moreover, technical buying on a sustained strength above the 1.2300 mark further contributes to the GBP/USD pair’s positive move on Wednesday. The fundamental backdrop as well as the technical setup favours bullish traders and supports prospects for a further near-term appreciating move. Investors now look to the US economic docket, highlighting the release of the Producer Price Index and Retail Sales data. Apart from this, speeches by influential FOMC members and the USD bond yields could provide a fresh impetus.
Technical Levels: Supports and Resistances
GBPUSD currently trading at 1.2372 at the time of writing. Pair opened at 1.2279 and is trading with a change of 0.76 % .
| Overview | Overview.1 | |
|---|---|---|
| 0 | Today last price | 1.2372 |
| 1 | Today Daily Change | 0.0093 |
| 2 | Today Daily Change % | 0.7600 |
| 3 | Today daily open | 1.2279 |
The pair remains strongly bullish on the daily timeframe. It trades above its 20 SMA @ 1.2095, 50 SMA 1.2066, 100 SMA @ 1.1699 and 200 SMA @ 1.1989.
| Trends | Trends.1 | |
|---|---|---|
| 0 | Daily SMA20 | 1.2095 |
| 1 | Daily SMA50 | 1.2066 |
| 2 | Daily SMA100 | 1.1699 |
| 3 | Daily SMA200 | 1.1989 |
The previous day high was 1.23 while the previous day low was 1.2169. The daily 38.2% Fib levels comes at 1.225, expected to provide support. Similarly, the daily 61.8% fib level is at 1.2219, expected to provide support.
Note the levels of interest below:
- Pivot support is noted at 1.2199, 1.2119, 1.2069
- Pivot resistance is noted at 1.233, 1.238, 1.246
| Levels | Levels.1 |
|---|---|
| Previous Daily High | 1.2300 |
| Previous Daily Low | 1.2169 |
| Previous Weekly High | 1.2249 |
| Previous Weekly Low | 1.2086 |
| Previous Monthly High | 1.2447 |
| Previous Monthly Low | 1.1992 |
| Daily Fibonacci 38.2% | 1.2250 |
| Daily Fibonacci 61.8% | 1.2219 |
| Daily Pivot Point S1 | 1.2199 |
| Daily Pivot Point S2 | 1.2119 |
| Daily Pivot Point S3 | 1.2069 |
| Daily Pivot Point R1 | 1.2330 |
| Daily Pivot Point R2 | 1.2380 |
| Daily Pivot Point R3 | 1.2460 |
[/s2If]
Join Our Telegram Group
")


