#GBPUSD @ 1.23134 ticks up to renew five-week high after UK inflation numbers. (Pivot Orderbook analysis)
…
This is a premium post.
[s2If !current_user_can(access_s2member_level4)]Please register for PREMIUM VERSION HERE to read full post below containing analysis. In case of any error or you think you are not able to read the full post below, please email us at support#nehcap.com [lwa][/s2If] [s2If current_user_can(access_s2member_level4)]
- GBP/USD ticks up to renew five-week high after UK inflation numbers.
- UK CPI, RPI came in softer for December.
- UK Chancellor Jeremy Hunt hints at no tax cuts in the next budget.
- Downbeat yields underpinned US Dollar rebound ahead of US Retail Sales, PPI.
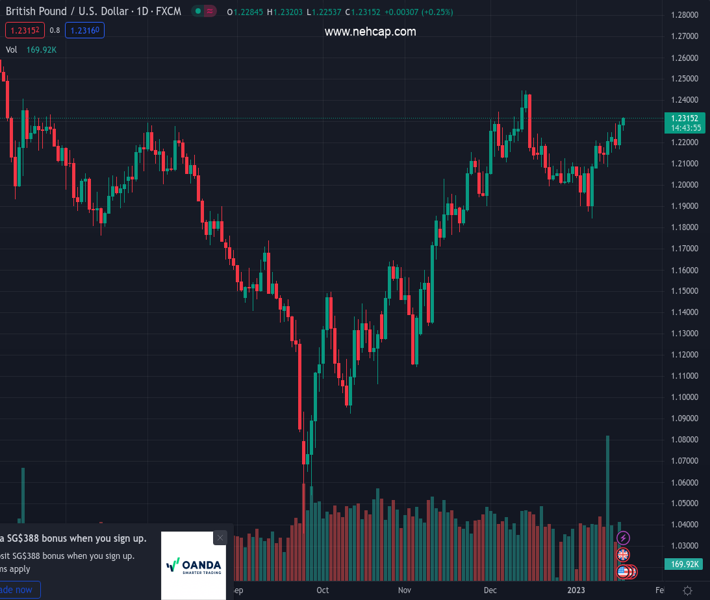
The pair currently trades last at 1.23134.
The previous day high was 1.23 while the previous day low was 1.2169. The daily 38.2% Fib levels comes at 1.225, expected to provide support. Similarly, the daily 61.8% fib level is at 1.2219, expected to provide support.
GBP/USD fails to justify the easing inflation pressure as it marches towards refreshing a five-week high to 1.2320 during early Wednesday morning in London. In doing so, the Cable pair also ignores fears of higher taxes in the next British budget.
That said, the UK Consumer Price Index (CPI) eased to 10.5% YoY versus 10.6% expected and 10.7% prior while the Retail Sales Index (RPI) dropped to 13.4% compared to 13.9% market expectations and 14.0% previous readings. Further, the Core CPI also reprinted 6.3% YoY level compared to market expectations of 6.6%.
Also read: Breaking: UK annualized inflation eases to 10.5% in December vs.10.6% expected
It should be noted that The Guardian ran a story suggesting more political drama over the tax cuts in the days ahead. “Jeremy Hunt is planning a “slimmed down” spring budget with no immediate tax cuts as the Conservatives press ahead with attempts to win back economic credibility after the damage inflicted by the Truss administration,” mentioned the news.
The early-week comments from Bank of England (BoE) Governor Andrew Bailey could be held responsible for the GBP/USD pair’s upside despite the softer inflation numbers. The policymaker has already expected softer inflation but didn’t retreat from rate hike bias.
On the other hand, the US Dollar Index (DXY) braces for the biggest daily gains in two weeks, up for the third consecutive day around 102.70 by the press time. In doing so, the greenback’s gauge versus the six major currencies cheers a slump in the Treasury yields triggered by the Bank of Japan’s (BoJ) inaction.
US Treasury bond yields reverse the early-day rebound while declining to 3.477% at the latest. The downbeat bond coupons, however, helped the S&P 500 futures to print mild intraday gains as we write. On the same line, Japanese Government Bonds (JGB) slumped to 0.362% after the BoJ announcements from 0.50% just before the BoJ.
Having witnessed the initial market reaction of the BoJ and the UK inflation, GBP/USD pair traders will wait for the US Retail Sales and Producer Price Index (PPI) for December, expected 0.1% and -0.1% MoM versus -0.6% and 0.3% respective priors, for clear directions.
GBP/USD portrays an eight-day-old rising wedge bearish chart formation. Not only the rising wedge but bearish RSI (14) divergence also keeps the Cable pair sellers hopeful. That said, the oscillator’s inability to back the higher-high on prices portrays the bearish RSI divergence.
Also read: GBP/USD Price Analysis: Rising wedge, bearish RSI divergence lure sellers ahead of UK inflation
Technical Levels: Supports and Resistances
GBPUSD currently trading at 1.2291 at the time of writing. Pair opened at 1.2279 and is trading with a change of 0.10% % .
| Overview | Overview.1 | |
|---|---|---|
| 0 | Today last price | 1.2291 |
| 1 | Today Daily Change | 0.0012 |
| 2 | Today Daily Change % | 0.10% |
| 3 | Today daily open | 1.2279 |
The pair remains strongly bullish on the daily timeframe. It trades above its 20 SMA @ 1.2095, 50 SMA 1.2066, 100 SMA @ 1.1699 and 200 SMA @ 1.1989.
| Trends | Trends.1 | |
|---|---|---|
| 0 | Daily SMA20 | 1.2095 |
| 1 | Daily SMA50 | 1.2066 |
| 2 | Daily SMA100 | 1.1699 |
| 3 | Daily SMA200 | 1.1989 |
The previous day high was 1.23 while the previous day low was 1.2169. The daily 38.2% Fib levels comes at 1.225, expected to provide support. Similarly, the daily 61.8% fib level is at 1.2219, expected to provide support.
Note the levels of interest below:
- Pivot support is noted at 1.2199, 1.2119, 1.2069
- Pivot resistance is noted at 1.233, 1.238, 1.246
| Levels | Levels.1 |
|---|---|
| Previous Daily High | 1.2300 |
| Previous Daily Low | 1.2169 |
| Previous Weekly High | 1.2249 |
| Previous Weekly Low | 1.2086 |
| Previous Monthly High | 1.2447 |
| Previous Monthly Low | 1.1992 |
| Daily Fibonacci 38.2% | 1.2250 |
| Daily Fibonacci 61.8% | 1.2219 |
| Daily Pivot Point S1 | 1.2199 |
| Daily Pivot Point S2 | 1.2119 |
| Daily Pivot Point S3 | 1.2069 |
| Daily Pivot Point R1 | 1.2330 |
| Daily Pivot Point R2 | 1.2380 |
| Daily Pivot Point R3 | 1.2460 |
[/s2If]
Join Our Telegram Group
")


