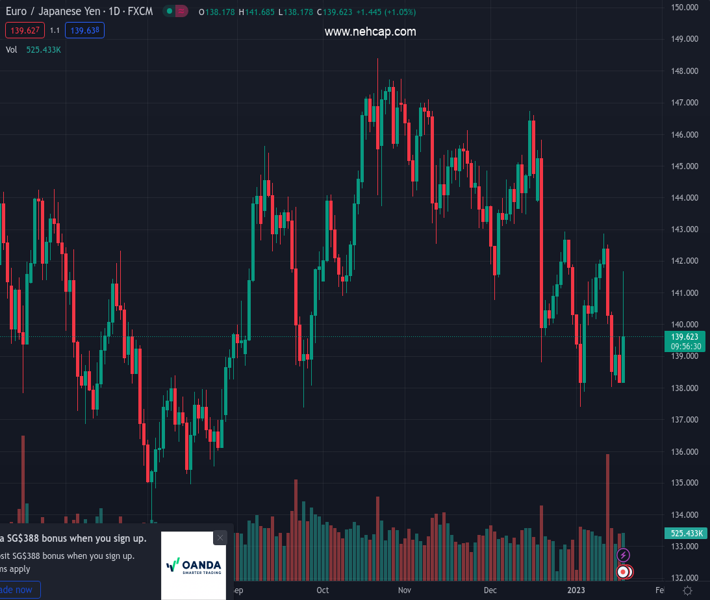
#EURJPY @ 139.636 climbs sharply and pierces the 141.00 mark on Wednesday. (Pivot Orderbook analysis)
…
This is a premium post.
[s2If !current_user_can(access_s2member_level4)]Please register for PREMIUM VERSION HERE to read full post below containing analysis. In case of any error or you think you are not able to read the full post below, please email us at support#nehcap.com [lwa][/s2If] [s2If current_user_can(access_s2member_level4)]
- EUR/JPY climbs sharply and pierces the 141.00 mark on Wednesday.
- The breakout of the 200-day SMA should restore the bullish outlook.
The pair currently trades last at 139.636.
The previous day high was 139.62 while the previous day low was 138.2. The daily 38.2% Fib levels comes at 138.74, expected to provide support. Similarly, the daily 61.8% fib level is at 139.08, expected to provide support.
EUR/JPY picks up marked buying interest and trespasses the 141.00 barrier to clinch new multi-day highs on Wednesday.
The cross needs to clear the 200-day SMA in quite a convincing fashion to shift the outlook to a more constructive one, ideally in the very near term. Extra gains from here should revisit the key resistance area near 143.00 (high December 28, January 11).
This key up barrier also appears underpinned by the 55-day SMA (142.92) and the 100-day SMA (143.10).
Technical Levels: Supports and Resistances
EURJPY currently trading at 140.17 at the time of writing. Pair opened at 138.38 and is trading with a change of 1.29 % .
| Overview | Overview.1 | |
|---|---|---|
| 0 | Today last price | 140.17 |
| 1 | Today Daily Change | 351.00 |
| 2 | Today Daily Change % | 1.29 |
| 3 | Today daily open | 138.38 |
The pair remains strongly bearish on the daily time frame. It trades below the 20 SMA @ 140.58, 50 SMA 142.75, 100 SMA @ 143.14 and 200 SMA @ 140.73.
| Trends | Trends.1 | |
|---|---|---|
| 0 | Daily SMA20 | 140.58 |
| 1 | Daily SMA50 | 142.75 |
| 2 | Daily SMA100 | 143.14 |
| 3 | Daily SMA200 | 140.73 |
The previous day high was 139.62 while the previous day low was 138.2. The daily 38.2% Fib levels comes at 138.74, expected to provide support. Similarly, the daily 61.8% fib level is at 139.08, expected to provide support.
Note the levels of interest below:
- Pivot support is noted at 137.85, 137.32, 136.43
- Pivot resistance is noted at 139.27, 140.15, 140.69
| Levels | Levels.1 |
|---|---|
| Previous Daily High | 139.62 |
| Previous Daily Low | 138.20 |
| Previous Weekly High | 142.86 |
| Previous Weekly Low | 138.01 |
| Previous Monthly High | 146.73 |
| Previous Monthly Low | 138.80 |
| Daily Fibonacci 38.2% | 138.74 |
| Daily Fibonacci 61.8% | 139.08 |
| Daily Pivot Point S1 | 137.85 |
| Daily Pivot Point S2 | 137.32 |
| Daily Pivot Point S3 | 136.43 |
| Daily Pivot Point R1 | 139.27 |
| Daily Pivot Point R2 | 140.15 |
| Daily Pivot Point R3 | 140.69 |
[/s2If]
Join Our Telegram Group
")


