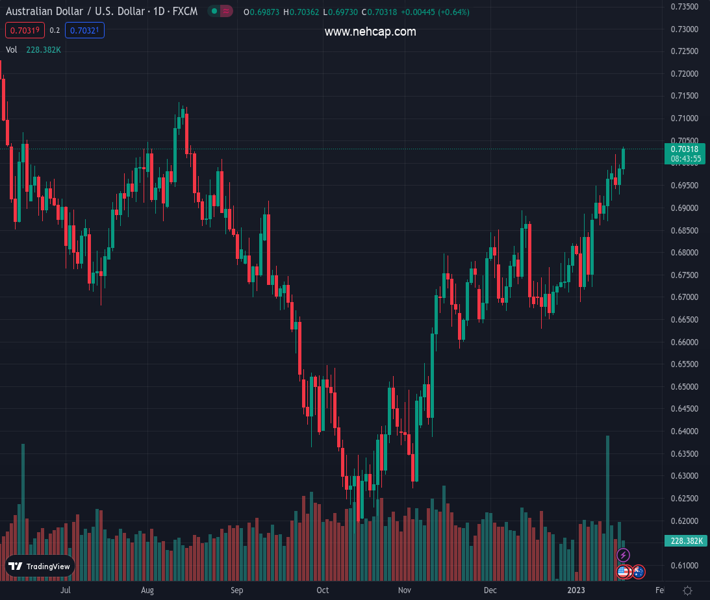
#AUDUSD @ 0.70328 scales higher for the second straight day and climbs to a fresh multi-month peak. (Pivot Orderbook analysis)
…
This is a premium post.
[s2If !current_user_can(access_s2member_level4)]Please register for PREMIUM VERSION HERE to read full post below containing analysis. In case of any error or you think you are not able to read the full post below, please email us at support#nehcap.com [lwa][/s2If] [s2If current_user_can(access_s2member_level4)]
- AUD/USD scales higher for the second straight day and climbs to a fresh multi-month peak.
- The emergence of heavy selling around the USD is seen acting as a tailwind for the major.
- Rising bets for an additional rate hike by the RBA remain supportive of the positive move.
- Traders now look forward to the US PPI and monthly Retail Sales data for a fresh impetus.
The pair currently trades last at 0.70328.
The previous day high was 0.6997 while the previous day low was 0.693. The daily 38.2% Fib levels comes at 0.6971, expected to provide support. Similarly, the daily 61.8% fib level is at 0.6956, expected to provide support.
The AUD/USD pair gains strong follow-through traction for the second successive day on Wednesday and continues scaling higher through the mid-European session. The positive momentum lifts spot prices to the 0.7035 area, or the highest level since August 16, during the mid-European session and is sponsored by the heavily offered tone surrounding the US Dollar.
In fact, the USD Index, which tracks the greenback’s performance against a basket of currencies, drops closer to a seven-month low touched earlier this week and is pressured by a combination of factors. The prospects for smaller interest rate hikes by the Fed trigger a fresh leg down in the US Treasury bond yields. Apart from this, a generally positive tone around the equity markets further undermines the safe-haven greenback and benefits the risk-sensitive Aussie.
Investors turned optimism amid hopes that more stimulus measures announced by the Chinese government will lead to a strong recovery in the world’s second-largest economy. Apart from this, rising odds for an additional interest rate hike by the Reserve Bank of Australia (RBA) in February lends some support to the domestic currency and acts as a tailwind for the AUD/USD pair. Wednesday’s positive move could also be attributed to technical buying above the 0.7000 psychological mark.
The aforementioned fundamental backdrop favours bullish traders and supports prospects for a further near-term appreciating move for the AUD/USD pair. Hence, any meaningful corrective pullback could be seen as a buying opportunity and is more likely to remain limited. Market participants now look forward to the US economic docket, highlighting the release of the Producer Price Index and monthly Retail Sales data for short-term trading opportunities.
Technical Levels: Supports and Resistances
AUDUSD currently trading at 0.7024 at the time of writing. Pair opened at 0.6986 and is trading with a change of 0.54 % .
| Overview | Overview.1 | |
|---|---|---|
| 0 | Today last price | 0.7024 |
| 1 | Today Daily Change | 0.0038 |
| 2 | Today Daily Change % | 0.5400 |
| 3 | Today daily open | 0.6986 |
The pair remains strongly bullish on the daily timeframe. It trades above its 20 SMA @ 0.6823, 50 SMA 0.6758, 100 SMA @ 0.6637 and 200 SMA @ 0.6827.
| Trends | Trends.1 | |
|---|---|---|
| 0 | Daily SMA20 | 0.6823 |
| 1 | Daily SMA50 | 0.6758 |
| 2 | Daily SMA100 | 0.6637 |
| 3 | Daily SMA200 | 0.6827 |
The previous day high was 0.6997 while the previous day low was 0.693. The daily 38.2% Fib levels comes at 0.6971, expected to provide support. Similarly, the daily 61.8% fib level is at 0.6956, expected to provide support.
Note the levels of interest below:
- Pivot support is noted at 0.6945, 0.6904, 0.6877
- Pivot resistance is noted at 0.7012, 0.7038, 0.708
| Levels | Levels.1 |
|---|---|
| Previous Daily High | 0.6997 |
| Previous Daily Low | 0.6930 |
| Previous Weekly High | 0.6994 |
| Previous Weekly Low | 0.6860 |
| Previous Monthly High | 0.6893 |
| Previous Monthly Low | 0.6629 |
| Daily Fibonacci 38.2% | 0.6971 |
| Daily Fibonacci 61.8% | 0.6956 |
| Daily Pivot Point S1 | 0.6945 |
| Daily Pivot Point S2 | 0.6904 |
| Daily Pivot Point S3 | 0.6877 |
| Daily Pivot Point R1 | 0.7012 |
| Daily Pivot Point R2 | 0.7038 |
| Daily Pivot Point R3 | 0.7080 |
[/s2If]
Join Our Telegram Group
")


