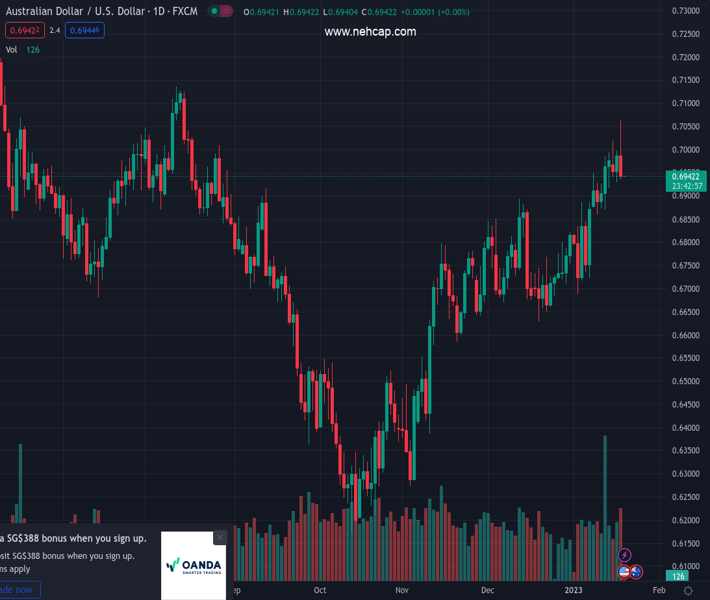
#AUDUSD @ 0.69411 remains sidelined after positing the daily loss by reversing from five-month high. (Pivot Orderbook analysis)
…
This is a premium post.
[s2If !current_user_can(access_s2member_level4)]Please register for PREMIUM VERSION HERE to read full post below containing analysis. In case of any error or you think you are not able to read the full post below, please email us at support#nehcap.com [lwa][/s2If] [s2If current_user_can(access_s2member_level4)]
- AUD/USD remains sidelined after positing the daily loss by reversing from five-month high.
- Sour sentiment, cautious mood ahead of Aussie data underpinned AUD/USD weakness.
- Hawkish Fedspeak, fears of US recession and mixed headlines on China gained major attention.
- Australia employment numbers for December will be crucial amid fears of east rate hikes.
The pair currently trades last at 0.69411.
The previous day high was 0.6997 while the previous day low was 0.693. The daily 38.2% Fib levels comes at 0.6971, expected to provide resistance. Similarly, the daily 61.8% fib level is at 0.6956, expected to provide resistance.
AUD/USD stabilizes around the mid-0.6900s as traders await the key Australia jobs report for December, after taking a U-turn from the highest levels in nearly five months and posting the biggest daily loss in a fortnight the previous day.
The Aussie pair’s losses on Wednesday could be linked to the market’s fresh fears of recession, even if the Bank of Japan (BOJ) tried to please the bulls earlier in the day. Adding strength to the bearish move could be the mixed headlines surrounding China and cautious mood ahead of Australia’s December employment data.
The risk-aversion could be linked to the hawkish Fedspeak and downbeat US data, as well as fears of the US-China tension.
That said, St. Louis Federal Reserve’s President James Bullard said US interest rates have to rise further to ensure that inflationary pressures recede. On the same line, President of the Federal Reserve Bank of Cleveland Loretta Mester praised the Fed’s actions to tame inflation and Kansas City Fed President Esther George mentioned that the central bank must restore price stability, “that means returning to 2% inflation.”
Elsewhere, US Retail Sales marked the biggest slump in a year while posting 1.1% MoM contraction for December, versus -0.8% market forecasts and -1.0% prior (revised). On the same line, Producer Price Index dropped to the lowest levels in six months with -0.5% MoM figure compared to -0.1% expected and 0.2% prior (revised).
Amid these plays, Wall Street closed in the red and yields were down too while the US Dollar recovered after refreshing the lowest levels since late May.
Looking forward, AUD/USD traders will pay attention to Australia’s employment numbers for December amid talks of easing hawkish bias at the major central banks, including the Reserve Bank of Australia (RBA). Hence, a softer outcome may exert more downside pressure on the AUD/USD prices.
Wednesday’s U-turn from the highest levels since the mid-August 2022 portrays a rising wedge bearish chart patter on the daily formation, currently between 0.7020 and 0.6810.
Technical Levels: Supports and Resistances
AUDUSD currently trading at 0.6944 at the time of writing. Pair opened at 0.6986 and is trading with a change of -0.60% % .
| Overview | Overview.1 | |
|---|---|---|
| 0 | Today last price | 0.6944 |
| 1 | Today Daily Change | -0.0042 |
| 2 | Today Daily Change % | -0.60% |
| 3 | Today daily open | 0.6986 |
The pair remains strongly bullish on the daily timeframe. It trades above its 20 SMA @ 0.6823, 50 SMA 0.6758, 100 SMA @ 0.6637 and 200 SMA @ 0.6827.
| Trends | Trends.1 | |
|---|---|---|
| 0 | Daily SMA20 | 0.6823 |
| 1 | Daily SMA50 | 0.6758 |
| 2 | Daily SMA100 | 0.6637 |
| 3 | Daily SMA200 | 0.6827 |
The previous day high was 0.6997 while the previous day low was 0.693. The daily 38.2% Fib levels comes at 0.6971, expected to provide resistance. Similarly, the daily 61.8% fib level is at 0.6956, expected to provide resistance.
Note the levels of interest below:
- Pivot support is noted at 0.6945, 0.6904, 0.6877
- Pivot resistance is noted at 0.7012, 0.7038, 0.708
| Levels | Levels.1 |
|---|---|
| Previous Daily High | 0.6997 |
| Previous Daily Low | 0.6930 |
| Previous Weekly High | 0.6994 |
| Previous Weekly Low | 0.6860 |
| Previous Monthly High | 0.6893 |
| Previous Monthly Low | 0.6629 |
| Daily Fibonacci 38.2% | 0.6971 |
| Daily Fibonacci 61.8% | 0.6956 |
| Daily Pivot Point S1 | 0.6945 |
| Daily Pivot Point S2 | 0.6904 |
| Daily Pivot Point S3 | 0.6877 |
| Daily Pivot Point R1 | 0.7012 |
| Daily Pivot Point R2 | 0.7038 |
| Daily Pivot Point R3 | 0.7080 |
[/s2If]
Join Our Telegram Group
")


