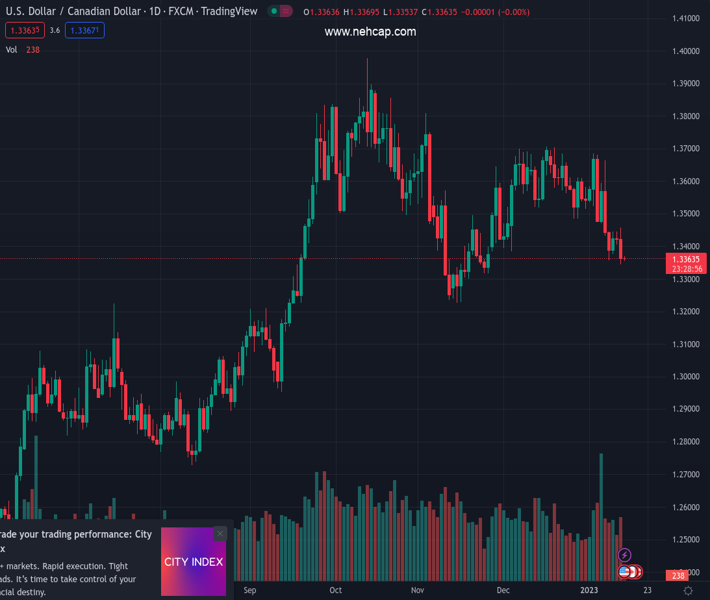
#USDCAD @ 1.33610 holds lower ground after dropping to seven-week low. (Pivot Orderbook analysis)
…
This is a premium post.
[s2If !current_user_can(access_s2member_level4)]Please register for PREMIUM VERSION HERE to read full post below containing analysis. In case of any error or you think you are not able to read the full post below, please email us at support#nehcap.com [lwa][/s2If] [s2If current_user_can(access_s2member_level4)]
- USD/CAD holds lower ground after dropping to seven-week low.
- Downbeat US CPI fuelled talks of Fed’s policy pivot and weighed on the US Dollar.
- WTI crude oil cheered softer USD, hopes of more energy demand.
- Risk catalysts, China trade balance and US Michigan CSI are important to watch for fresh impulse.
The pair currently trades last at 1.33610.
The previous day high was 1.3445 while the previous day low was 1.3404. The daily 38.2% Fib levels comes at 1.343, expected to provide resistance. Similarly, the daily 61.8% fib level is at 1.342, expected to provide resistance.
USD/CAD bears are taking a breather at the lowest levels in almost two months around 1.3365, following the biggest daily slump in a week, as traders seek more clues to extend the US inflation-led south-run. That said, the Loonie pair dropped heavily after the US Consumer Price Index (CPI) fuelled expectations of a softer Fed rate hike in December and drowned the US Dollar, which in turn allowed the WTI crude oil to print a four-day uptrend and refresh weekly top.
On Thursday, US Consumer Price Index (CPI) matched 6.5% YoY forecasts for December, versus 7.1% prior. More importantly, CPI ex Food & Energy also proved the market consensus of 5.7% YoY figure right, compared to 6.0% previous readings. It’s worth noting that the CPI MoM marked the first negative figure since June 2020 while marking a -0.1% figure for the stated month, versus 0.0% forecast and 0.1% prior.
Following the inflation readings, Futures tied to the Fed policy rate implied a nearly 100% chance of a 0.25% Fed rate hike in February while the odds favoring a 50 bps rate hike in the said month slumped to 8.0%.
The same should have allowed Federal Reserve Bank of Philadelphia President Patrick Harker to mention that it was time for future Fed rate hikes to shift to 25 basis points increments. Further, St. Louis Federal Reserve leader James Bullard also said that the most likely scenario is inflation remaining above 2%, so the policy rate will need to be higher for longer. Recently, Richmond Federal Reserve President Thomas Barkin mentioned that it “makes sense” to steer more deliberately as the Fed works to bring inflation down.
As a result, the US Dollar Index (DXY) dropped the most in a week to refresh the seven-week low.
On the other hand, WTI crude oil renewed its weekly high around $79.35 before ending Thursday near $78.50. Even so, the black gold managed to print a four-day winning streak as broad-based US Dollar weakness joined the recent optimism surrounding China that suggests higher energy demand from the world’s biggest commodity user. It should be noted that Canada’s reliance on crude oil exports as the major earner make the Canadian Dollar (CAD) susceptible to Oil prices.
Against this backdrop, Wall Street managed to close in the green while the US 10-year and two-year Treasury bond yields refreshed monthly lows.
Looking forward, China trade numbers for December can offer immediate directions to the USD/CAD pair ahead of the preliminary readings of the US Michigan Consumer Sentiment Index (CSI) for January. Also important will be the news surrounding China and Fed moves.
Sustained trading below the 100-day EMA, around 1.3430 by the press time, joins bearish MACD signals and downbeat RSI line to keep USD/CAD bears hopeful of visiting November 2022 low near 1.3230.
Technical Levels: Supports and Resistances
USDCAD currently trading at 1.3364 at the time of writing. Pair opened at 1.3427 and is trading with a change of -0.47% % .
| Overview | Overview.1 | |
|---|---|---|
| 0 | Today last price | 1.3364 |
| 1 | Today Daily Change | -0.0063 |
| 2 | Today Daily Change % | -0.47% |
| 3 | Today daily open | 1.3427 |
The pair is trading below its 20 Daily moving average @ 1.3563, below its 50 Daily moving average @ 1.3507 , below its 100 Daily moving average @ 1.3488 and above its 200 Daily moving average @ 1.3161
| Trends | Trends.1 | |
|---|---|---|
| 0 | Daily SMA20 | 1.3563 |
| 1 | Daily SMA50 | 1.3507 |
| 2 | Daily SMA100 | 1.3488 |
| 3 | Daily SMA200 | 1.3161 |
The previous day high was 1.3445 while the previous day low was 1.3404. The daily 38.2% Fib levels comes at 1.343, expected to provide resistance. Similarly, the daily 61.8% fib level is at 1.342, expected to provide resistance.
Note the levels of interest below:
- Pivot support is noted at 1.3406, 1.3385, 1.3366
- Pivot resistance is noted at 1.3447, 1.3466, 1.3487
| Levels | Levels.1 |
|---|---|
| Previous Daily High | 1.3445 |
| Previous Daily Low | 1.3404 |
| Previous Weekly High | 1.3685 |
| Previous Weekly Low | 1.3433 |
| Previous Monthly High | 1.3705 |
| Previous Monthly Low | 1.3385 |
| Daily Fibonacci 38.2% | 1.3430 |
| Daily Fibonacci 61.8% | 1.3420 |
| Daily Pivot Point S1 | 1.3406 |
| Daily Pivot Point S2 | 1.3385 |
| Daily Pivot Point S3 | 1.3366 |
| Daily Pivot Point R1 | 1.3447 |
| Daily Pivot Point R2 | 1.3466 |
| Daily Pivot Point R3 | 1.3487 |
[/s2If]
Join Our Telegram Group
")


