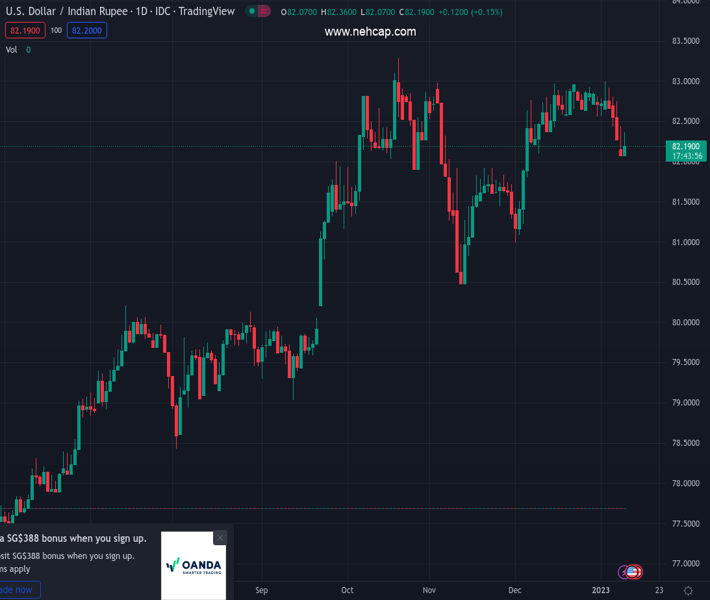
#USDINR @ 82.1720 seesaws near one-month low, bears take a breather after four-day downtrend. (Pivot Orderbook analysis)
…
This is a premium post.
[s2If !current_user_can(access_s2member_level4)]Please register for PREMIUM VERSION HERE to read full post below containing analysis. In case of any error or you think you are not able to read the full post below, please email us at support#nehcap.com [lwa][/s2If] [s2If current_user_can(access_s2member_level4)]
- USD/INR seesaws near one-month low, bears take a breather after four-day downtrend.
- Market sentiment dwindles on mixed updates from China, hawkish Fed talks.
- Easy prices of oil, technical breakdown keeps Indian Rupee buyers hopeful.
- Fed Chair Powell’s speech, US inflation data will be crucial for clear directions.
The pair currently trades last at 82.1720.
The previous day high was 82.4595 while the previous day low was 82.0724. The daily 38.2% Fib levels comes at 82.2203, expected to provide resistance. Similarly, the daily 61.8% fib level is at 82.3116, expected to provide resistance.
USD/INR stays defensive around 82.15-20 as it probes bears for the first time in five days during early Tuesday. In doing so, the Indian Rupee (INR) pair takes clues from the US Dollar’s rebound amid the mixed sentiment and anxiety ahead of the key catalysts. However, softer prices of oil and a downside break of 82.40 keeps the pair sellers hopeful.
US Dollar Index (DXY) makes rounds to 103.15-20 as sellers pause after a two-day downtrend around the lowest level since June 2022. That said, the greenback’s gauge versus the six major currencies takes clues from a rebound in the US Treasury yields, as well as the hawkish statements from the Federal Reserve (Fed) officials.
Atlanta Federal Reserve bank president Raphael Bostic said on Monday that it is ”fair to say that the Fed is willing to overshoot.” On the same line, San Francisco Federal Reserve Bank President Mary Daly stated that they are determined, united, resolute to bring inflation down.
Additionally, the Federal Reserve Bank of New York’s monthly Survey of Consumer Expectations showed on Monday that the US consumers’ one-year inflation expectations declined to 5% in December from 5.2% prior. However, the three-year ahead expected inflation remained unchanged at 3% and the five-year ahead expected inflation edged higher to 2.4% from 2.3%.
Elsewhere, headlines from Bloomberg suggesting fears of high COVID-19 figures from rural China, as the holiday season in the Asian major looms, also tease the USD/INR bulls. The news cites the death of facilities and drugs, as well as experts’ fears of a spike in Covid cases in January, to challenge the optimism surrounding China.
It should be observed that the WTI crude oil prices fade the previous day’s rebound, down 0.61% intraday near $74.55 by the press time, as risk-aversion weighs on the energy benchmark.
Against this backdrop, the S&P 500 Futures remain lackluster around 3,915, down 0.05% intraday, whereas the US 10-year Treasury yields seesaw around a three-week low marked the previous day, close to 3.52% by the press time.
Given the latest rebound in the USD/INR prices, the pair traders will pay higher attention to Fed Chair Jerome Powell’s panel discussion for possible clues on the hawkish moves of the US central bank.
A clear downside break of the 82.40 support keeps USD/INR bears hopeful of revisiting the 82.00 threshold.
Technical Levels: Supports and Resistances
USDINR currently trading at 82.1599 at the time of writing. Pair opened at 82.182 and is trading with a change of -0.03% % .
| Overview | Overview.1 | |
|---|---|---|
| 0 | Today last price | 82.1599 |
| 1 | Today Daily Change | -0.0221 |
| 2 | Today Daily Change % | -0.03% |
| 3 | Today daily open | 82.182 |
The pair is trading below its 20 Daily moving average @ 82.6699, above its 50 Daily moving average @ 82.11 , above its 100 Daily moving average @ 81.5895 and above its 200 Daily moving average @ 79.836
| Trends | Trends.1 | |
|---|---|---|
| 0 | Daily SMA20 | 82.6699 |
| 1 | Daily SMA50 | 82.1100 |
| 2 | Daily SMA100 | 81.5895 |
| 3 | Daily SMA200 | 79.8360 |
The previous day high was 82.4595 while the previous day low was 82.0724. The daily 38.2% Fib levels comes at 82.2203, expected to provide resistance. Similarly, the daily 61.8% fib level is at 82.3116, expected to provide resistance.
Note the levels of interest below:
- Pivot support is noted at 82.0164, 81.8509, 81.6293
- Pivot resistance is noted at 82.4035, 82.6251, 82.7906
| Levels | Levels.1 |
|---|---|
| Previous Daily High | 82.4595 |
| Previous Daily Low | 82.0724 |
| Previous Weekly High | 83.0720 |
| Previous Weekly Low | 82.1896 |
| Previous Monthly High | 84.2500 |
| Previous Monthly Low | 80.9855 |
| Daily Fibonacci 38.2% | 82.2203 |
| Daily Fibonacci 61.8% | 82.3116 |
| Daily Pivot Point S1 | 82.0164 |
| Daily Pivot Point S2 | 81.8509 |
| Daily Pivot Point S3 | 81.6293 |
| Daily Pivot Point R1 | 82.4035 |
| Daily Pivot Point R2 | 82.6251 |
| Daily Pivot Point R3 | 82.7906 |
[/s2If]
Join Our Telegram Group
")


