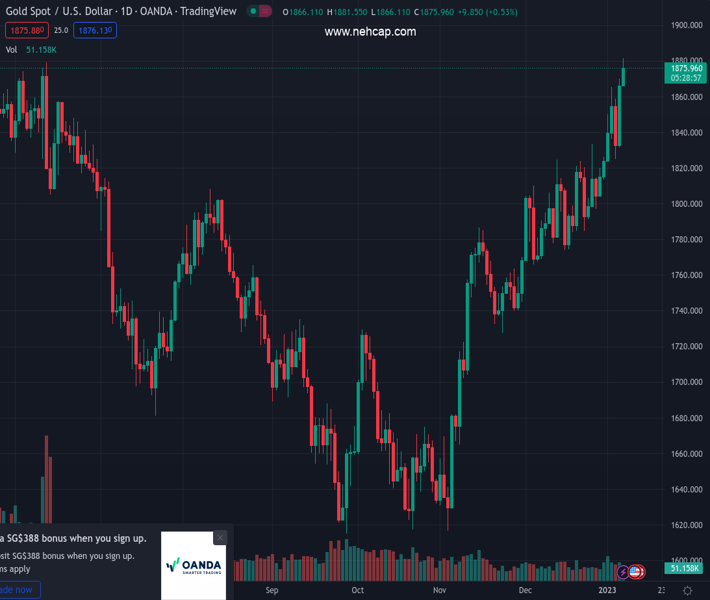
#XAUUSD @ 1,876.49 Gold price holds onto recent gains as the rally in Wall Street continues. (Pivot Orderbook analysis)
…
This is a premium post.
[s2If !current_user_can(access_s2member_level4)]Please register for PREMIUM VERSION HERE to read full post below containing analysis. In case of any error or you think you are not able to read the full post below, please email us at support#nehcap.com [lwa][/s2If] [s2If current_user_can(access_s2member_level4)]
- Gold price holds onto recent gains as the rally in Wall Street continues.
- A weaker US Dollar offers support to XAU/USD that continues to look at $1,880.
- Strong demand for Treasury bonds as market participants await a less hawkish Fed.
The pair currently trades last at 1876.49.
The previous day high was 1869.91 while the previous day low was 1830.62. The daily 38.2% Fib levels comes at 1854.9, expected to provide support. Similarly, the daily 61.8% fib level is at 1845.63, expected to provide support.
Gold prices are holding up and near the $1,880 area on Monday, supported by another slide of the US Dollar across the board, amid risk appetite and lower US Treasury bond yields. Technical bias points to further gains for the yellow metal.
The US Dollar, measured by the DXY is trading at the lowest level since June 2022, approaching 103.00, down 0.75% for the day, falling for the second day in a row. The greenback weakened on Friday following US economic data that included a mixed NFP report and an concerning ISM Service Sector PMI report.
Even USD/JPY is trading in negative territory on Monday after being unable to hold onto daily gain, and is back under 132.00. EUR/USD is at the highest level in six months while AUD/USD is at 0.6950, the highest since late August.
Last week’s economic data boosted speculations about a slowdown in the Fed rate hike cycle, favoring an increase of 25 basis points instead of a 50 bps. US Treasury yields tumbled on Friday and remains near the lows on Monday, with the US 10-year Treasury yield at 3.55%, the lowest since December 19 and the 2-year at 4.22%.
European yields are modestly higher but still near weekly lows. The rise in sovereign bond yields is a positive development for gold prices. As long as the market environment favors less hawkish monetary policy in Europe and the US, XAU/USD will likely remain strong.
Risk appetite: other positive for gold
After rising more than 2% on Friday, US equity prices are having another great day. The S&P 500 is up by 1.25% and the Nasdaq gains almost 2%. The improvement in market sentiment is also boosting commodity prices. The WTI barrel is at 75.85$, off highs but by 2.75%. Even cryptocurrencies are up with Bictoin at $17,260 and Ethereum up by 5.35% at $1,337.
Last week, XAU/USD broke above $1,830, and it consolidated above strengthening the outlook for the yellow metal. The price peaked on Monday at $1,881.53, the highest level since June. It then pulled back finding support above $1,870.
The RSI is about to hit overbought readings suggesting that a correction or a consolidation might take place before the next leg higher. The next target is seen at $1,890, the last line of defence for a test of $1,900.
The bullish outlook for gold prices will remain strong while it holds above $1,825/30. The mentioned zone is a strong horizontal support and also currently an uptrend line is seen. A break lower would favor more losses.
.
Technical Levels: Supports and Resistances
XAUUSD currently trading at 1875.23 at the time of writing. Pair opened at 1866.99 and is trading with a change of 0.44 % .
| Overview | Overview.1 | |
|---|---|---|
| 0 | Today last price | 1875.23 |
| 1 | Today Daily Change | 8.24 |
| 2 | Today Daily Change % | 0.44 |
| 3 | Today daily open | 1866.99 |
The pair remains strongly bullish on the daily timeframe. It trades above its 20 SMA @ 1812.3, 50 SMA 1768.68, 100 SMA @ 1726.95 and 200 SMA @ 1778.09.
| Trends | Trends.1 | |
|---|---|---|
| 0 | Daily SMA20 | 1812.30 |
| 1 | Daily SMA50 | 1768.68 |
| 2 | Daily SMA100 | 1726.95 |
| 3 | Daily SMA200 | 1778.09 |
The previous day high was 1869.91 while the previous day low was 1830.62. The daily 38.2% Fib levels comes at 1854.9, expected to provide support. Similarly, the daily 61.8% fib level is at 1845.63, expected to provide support.
Note the levels of interest below:
- Pivot support is noted at 1841.77, 1816.55, 1802.48
- Pivot resistance is noted at 1881.06, 1895.13, 1920.35
| Levels | Levels.1 |
|---|---|
| Previous Daily High | 1869.91 |
| Previous Daily Low | 1830.62 |
| Previous Weekly High | 1869.91 |
| Previous Weekly Low | 1823.76 |
| Previous Monthly High | 1833.38 |
| Previous Monthly Low | 1765.89 |
| Daily Fibonacci 38.2% | 1854.90 |
| Daily Fibonacci 61.8% | 1845.63 |
| Daily Pivot Point S1 | 1841.77 |
| Daily Pivot Point S2 | 1816.55 |
| Daily Pivot Point S3 | 1802.48 |
| Daily Pivot Point R1 | 1881.06 |
| Daily Pivot Point R2 | 1895.13 |
| Daily Pivot Point R3 | 1920.35 |
[/s2If]
Join Our Telegram Group
")


