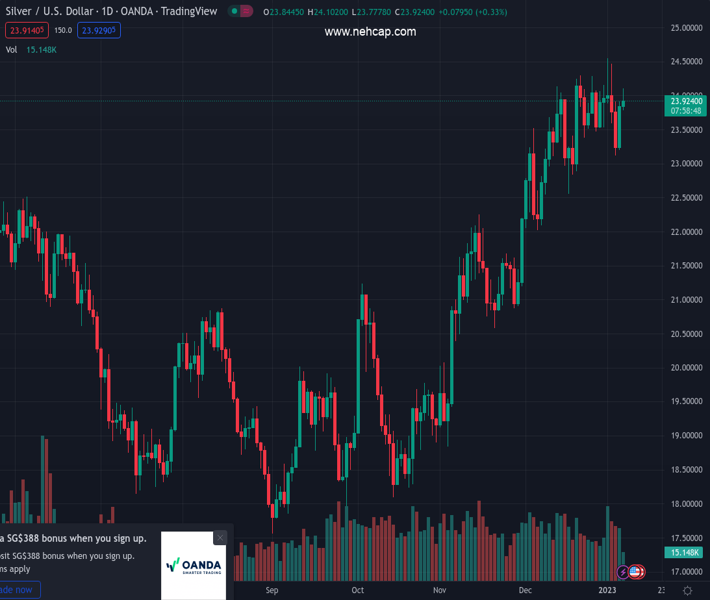
#XAGUSD @ 23.900 Silver struggles to capitalize on its modest intraday gains beyond the $24.00 mark. (Pivot Orderbook analysis)
…
This is a premium post.
[s2If !current_user_can(access_s2member_level4)]Please register for PREMIUM VERSION HERE to read full post below containing analysis. In case of any error or you think you are not able to read the full post below, please email us at support#nehcap.com [lwa][/s2If] [s2If current_user_can(access_s2member_level4)]
- Silver struggles to capitalize on its modest intraday gains beyond the $24.00 mark.
- The technical set-up favours bullish traders and supports prospects for further gains.
- A convincing break below the $23.00 mark is needed to negate the positive outlook.
The pair currently trades last at 23.900.
The previous day high was 23.91 while the previous day low was 23.2. The daily 38.2% Fib levels comes at 23.64, expected to provide support. Similarly, the daily 61.8% fib level is at 23.47, expected to provide support.
Silver builds on Friday’s goodish rebound from the vicinity of the $23.00 mark and gains some follow-through traction on the first day of a new week. The white metal, however, struggles to find acceptance above the $24.00 round figure and retreats from a three-day high touched during the first half of the European session.
The XAG/USD, meanwhile, manages to defend the 100-period SMA on the 4-hour chart, around the $23.70 area, and the technical set-up still seems tilted in favour of bullish traders. The outlook is reinforced by positive oscillators on daily/hourly charts. That said, it will still be prudent to wait for a sustained strength beyond the $24.00 mark before positioning for any further appreciating move.
The XAG/USD might then aim to surpass an intermediate hurdle near the $24.25 region, which is followed by the multi-month high, around the $24.50-$24.55 region touched last week. Some follow-through buying beyond the latter will be seen as a fresh trigger for bullish traders and lift spot prices further towards reclaiming the $25.00 psychological mark for the first time since April 2022.
On the flip side, the $23.20-$23.10 area now seems to have emerged as immediate support ahead of the $23.00 round figure. A convincing break below could drag the XAG/USD towards the $22.60-$22.55 region en route to the next relevant support near the $22.10-$22.00 horizontal zone. Failure to defend the latter will mark a breakdown and set the stage for a further near-term depreciating move.
Technical Levels: Supports and Resistances
XAGUSD currently trading at 23.83 at the time of writing. Pair opened at 23.84 and is trading with a change of -0.04 % .
| Overview | Overview.1 | |
|---|---|---|
| 0 | Today last price | 23.83 |
| 1 | Today Daily Change | -0.01 |
| 2 | Today Daily Change % | -0.04 |
| 3 | Today daily open | 23.84 |
The pair remains strongly bullish on the daily timeframe. It trades above its 20 SMA @ 23.68, 50 SMA 22.31, 100 SMA @ 20.71 and 200 SMA @ 21.1.
| Trends | Trends.1 | |
|---|---|---|
| 0 | Daily SMA20 | 23.68 |
| 1 | Daily SMA50 | 22.31 |
| 2 | Daily SMA100 | 20.71 |
| 3 | Daily SMA200 | 21.10 |
The previous day high was 23.91 while the previous day low was 23.2. The daily 38.2% Fib levels comes at 23.64, expected to provide support. Similarly, the daily 61.8% fib level is at 23.47, expected to provide support.
Note the levels of interest below:
- Pivot support is noted at 23.39, 22.94, 22.68
- Pivot resistance is noted at 24.1, 24.36, 24.81
| Levels | Levels.1 |
|---|---|
| Previous Daily High | 23.91 |
| Previous Daily Low | 23.20 |
| Previous Weekly High | 24.55 |
| Previous Weekly Low | 23.12 |
| Previous Monthly High | 24.30 |
| Previous Monthly Low | 22.03 |
| Daily Fibonacci 38.2% | 23.64 |
| Daily Fibonacci 61.8% | 23.47 |
| Daily Pivot Point S1 | 23.39 |
| Daily Pivot Point S2 | 22.94 |
| Daily Pivot Point S3 | 22.68 |
| Daily Pivot Point R1 | 24.10 |
| Daily Pivot Point R2 | 24.36 |
| Daily Pivot Point R3 | 24.81 |
[/s2If]
Join Our Telegram Group
")


