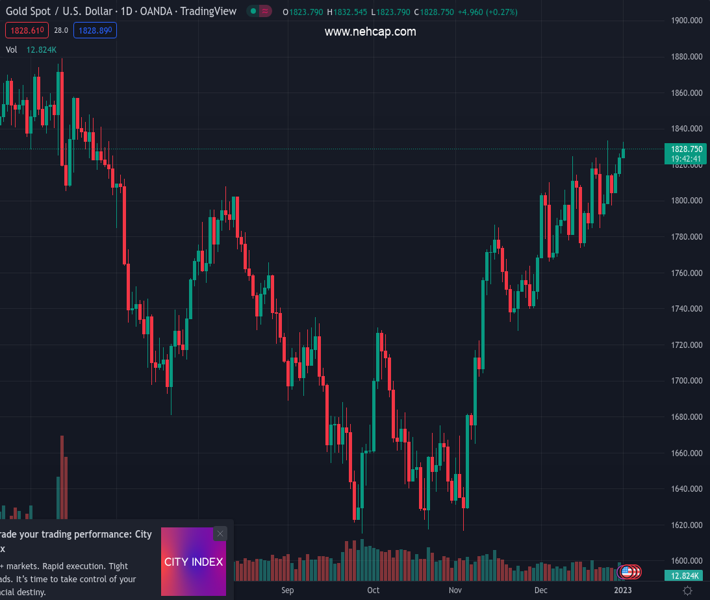
#XAUUSD @ 1,829.32 Gold price challenges six-month highs in a cautious start to 2023. (Pivot Orderbook analysis)
…
This is a premium post.
[s2If !current_user_can(access_s2member_level4)]Please register for PREMIUM VERSION HERE to read full post below containing analysis. In case of any error or you think you are not able to read the full post below, please email us at support#nehcap.com [lwa][/s2If] [s2If current_user_can(access_s2member_level4)]
- Gold price challenges six-month highs in a cautious start to 2023.
- US Dollar rebounds amid tepid sentiment as S&P 500 futures drop.
- Gold price awaits acceptance above $1,825 to validate an ascending triangle.
The pair currently trades last at 1829.32.
The previous day high was 1823.76 while the previous day low was 1823.76. The daily 38.2% Fib levels comes at 1823.76, expected to provide support. Similarly, the daily 61.8% fib level is at 1823.76, expected to provide support.
Gold price is challenging six-month highs while holding gains above the $1,825 key resistance level so far this Tuesday. Gold price is seeing a continuation of the recent uptrend at the start of 2023, despite the bounce in the US Dollar across the board.
Concerns over a potential global economic recession, China’s covid resurgence and higher inflation are weighing on the market sentiment, driving demand for the traditional safe-haven Gold price. Expectations that the US Federal Reserve (Fed) will continue its fight against raging inflation this year, by continuing its tightening cycle, keep investors’ sentiment broadly undermined.
The risk-off flows are also helping the US Dollar find a floor, capping the upside in the bright metal. Further, the US Treasury bond yields finished the final week of 2022 on an upbeat note, limiting the upside attempts in the non-yielding Gold price.
Attention now turns toward the first relevant US economic data due to be released this year, the S&P Global Manufacturing PMI for December, for fresh trading impetus. Markets will also closely await the Wall Street open for further cues on risk sentiment.
From a short-term technical perspective, Gold price is once again testing bearish commitments above the critical horizontal trendline (triangle) resistance at $1,825 this Tuesday.
Gold bulls need a daily closing above the horizontal trendline (triangle) resistance to confirm the ascending triangle breakout. Buyers will then aim for a fresh upswing toward the psychological $1,850 level. Ahead of that the $1,840 round figure could come into play.
The 14-day Relative Strength Index (RSI) is inching higher above the midline, backing the ongoing uptrend while the bullish crossovers continue to lend support to Gold bulls.
Alternatively, immediate support is seen at Friday’s low of $1,814. The next critical support awaits at the rising trendline (triangle support line) of $1,808. A breach of the latter could put the $1,800 threshold at risk, where the bullish 21-Daily Moving Average (DMA) hangs around.
Technical Levels: Supports and Resistances
XAUUSD currently trading at 1828.56 at the time of writing. Pair opened at 1823.76 and is trading with a change of 0.26 % .
| Overview | Overview.1 | |
|---|---|---|
| 0 | Today last price | 1828.56 |
| 1 | Today Daily Change | 4.79 |
| 2 | Today Daily Change % | 0.26 |
| 3 | Today daily open | 1823.76 |
The pair remains strongly bullish on the daily timeframe. It trades above its 20 SMA @ 1799.73, 50 SMA 1753.32, 100 SMA @ 1723.46 and 200 SMA @ 1779.69.
| Trends | Trends.1 | |
|---|---|---|
| 0 | Daily SMA20 | 1799.73 |
| 1 | Daily SMA50 | 1753.32 |
| 2 | Daily SMA100 | 1723.46 |
| 3 | Daily SMA200 | 1779.69 |
The previous day high was 1823.76 while the previous day low was 1823.76. The daily 38.2% Fib levels comes at 1823.76, expected to provide support. Similarly, the daily 61.8% fib level is at 1823.76, expected to provide support.
Note the levels of interest below:
- Pivot support is noted at 1823.76, 1823.76, 1823.76
- Pivot resistance is noted at 1823.76, 1823.76, 1823.76
| Levels | Levels.1 |
|---|---|
| Previous Daily High | 1823.76 |
| Previous Daily Low | 1823.76 |
| Previous Weekly High | 1833.38 |
| Previous Weekly Low | 1797.11 |
| Previous Monthly High | 1833.38 |
| Previous Monthly Low | 1765.89 |
| Daily Fibonacci 38.2% | 1823.76 |
| Daily Fibonacci 61.8% | 1823.76 |
| Daily Pivot Point S1 | 1823.76 |
| Daily Pivot Point S2 | 1823.76 |
| Daily Pivot Point S3 | 1823.76 |
| Daily Pivot Point R1 | 1823.76 |
| Daily Pivot Point R2 | 1823.76 |
| Daily Pivot Point R3 | 1823.76 |
[/s2If]
Join Our Telegram Group
")


