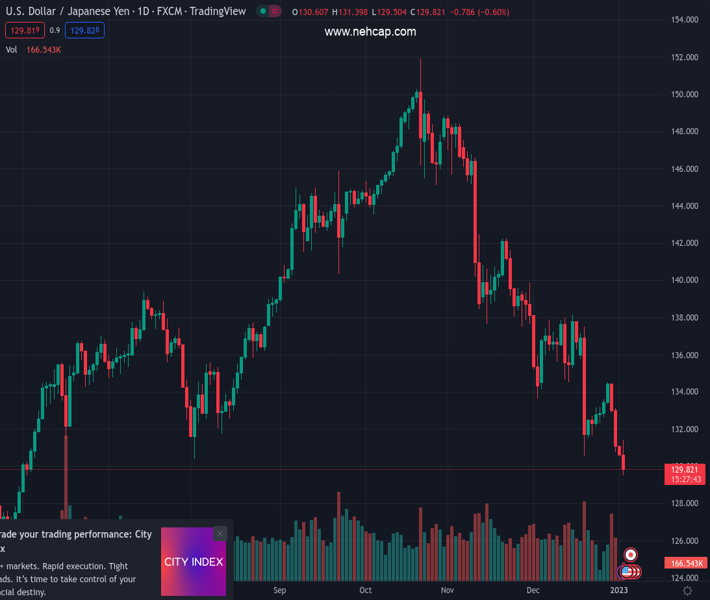
#USDJPY @ 129.791 has dropped below the psychological support of 130.00 amid a recovery in the risk-on profile. (Pivot Orderbook analysis)
…
This is a premium post.
[s2If !current_user_can(access_s2member_level4)]Please register for PREMIUM VERSION HERE to read full post below containing analysis. In case of any error or you think you are not able to read the full post below, please email us at support#nehcap.com [lwa][/s2If] [s2If current_user_can(access_s2member_level4)]
- USD/JPY has dropped below the psychological support of 130.00 amid a recovery in the risk-on profile.
- The sustainability of the asset below the 200-EMA indicates that the long-term trend is bearish.
- An oscillation in the bearish range by the RSI (14) signals more weakness ahead.
The pair currently trades last at 129.791.
The previous day high was 131.13 while the previous day low was 130.62. The daily 38.2% Fib levels comes at 130.82, expected to provide resistance. Similarly, the daily 61.8% fib level is at 130.94, expected to provide resistance.
The USD/JPY pair surrendered the psychological support of 130.00 in the early European session. The major has witnessed a steep fall after slipping below 130.50 in Tokyo amid an improvement in investors’ risk appetite.
S&P500 futures have managed to shift into the green trajectory after a weak opening post-long weekend, which signals that the risk aversion theme has faded. The US Dollar Index (DXY) is struggling to sustain above a two-week low around 103.15.
On the daily scale, the asset has surrendered the horizontal support placed from August 2 low around 130.40. The 20-period Exponential Moving Average (EMA) at 134.00 is continuously acting as a major barricade for the US Dollar. Also, the asset has shifted comfortably below the 200-EMA at 135.00, which indicates that the long-term trend is bearish.
Meanwhile, the Relative Strength Index (RSI) (14) has shifted into the bearish range of 20.00-40.00, which indicates that the bearish momentum is already active.
It would be prudent to wait for a pullback move to near the psychological resistance of 130.00 for building short positions, which will drag the asset towards May 4 low at 128.63 followed by May 24 low at 126.36.
On the flip side, a rebound move above December 29 high at 134.50 will drive the asset toward December 7 low around 134.00. A breach above the latter will send the asset toward December 20 high at 137.47.
Technical Levels: Supports and Resistances
USDJPY currently trading at 129.65 at the time of writing. Pair opened at 130.72 and is trading with a change of -0.82 % .
| Overview | Overview.1 | |
|---|---|---|
| 0 | Today last price | 129.65 |
| 1 | Today Daily Change | -1.07 |
| 2 | Today Daily Change % | -0.82 |
| 3 | Today daily open | 130.72 |
The pair remains strongly bearish on the daily time frame. It trades below the 20 SMA @ 134.6, 50 SMA 139.2, 100 SMA @ 141.08 and 200 SMA @ 136.26.
| Trends | Trends.1 | |
|---|---|---|
| 0 | Daily SMA20 | 134.60 |
| 1 | Daily SMA50 | 139.20 |
| 2 | Daily SMA100 | 141.08 |
| 3 | Daily SMA200 | 136.26 |
The previous day high was 131.13 while the previous day low was 130.62. The daily 38.2% Fib levels comes at 130.82, expected to provide resistance. Similarly, the daily 61.8% fib level is at 130.94, expected to provide resistance.
Note the levels of interest below:
- Pivot support is noted at 130.52, 130.31, 130.0
- Pivot resistance is noted at 131.03, 131.34, 131.55
| Levels | Levels.1 |
|---|---|
| Previous Daily High | 131.13 |
| Previous Daily Low | 130.62 |
| Previous Weekly High | 134.50 |
| Previous Weekly Low | 130.78 |
| Previous Monthly High | 138.18 |
| Previous Monthly Low | 130.57 |
| Daily Fibonacci 38.2% | 130.82 |
| Daily Fibonacci 61.8% | 130.94 |
| Daily Pivot Point S1 | 130.52 |
| Daily Pivot Point S2 | 130.31 |
| Daily Pivot Point S3 | 130.00 |
| Daily Pivot Point R1 | 131.03 |
| Daily Pivot Point R2 | 131.34 |
| Daily Pivot Point R3 | 131.55 |
[/s2If]
Join Our Telegram Group
")


