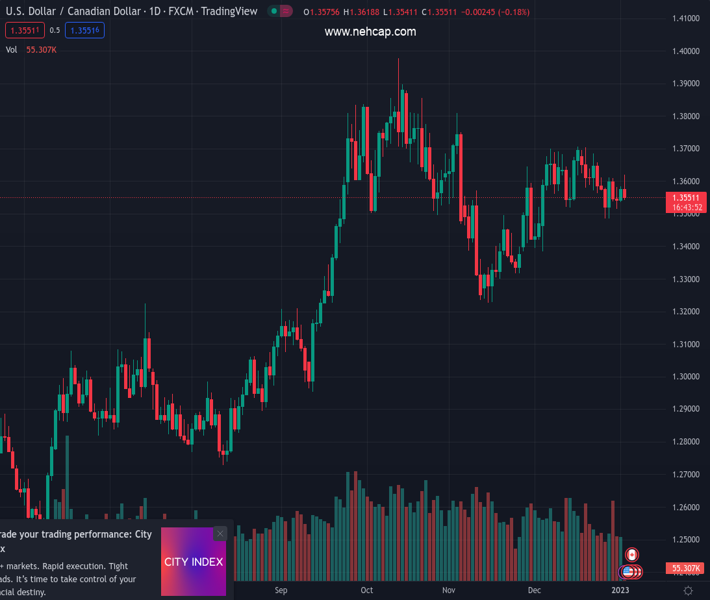
#USDCAD @ 1.35522 has displayed an A-shape sell-off as investors have shrugged off China’s Covid-inspired uncertainty. (Pivot Orderbook analysis)
…
This is a premium post.
[s2If !current_user_can(access_s2member_level4)]Please register for PREMIUM VERSION HERE to read full post below containing analysis. In case of any error or you think you are not able to read the full post below, please email us at support#nehcap.com [lwa][/s2If] [s2If current_user_can(access_s2member_level4)]
- USD/CAD has displayed an A-shape sell-off as investors have shrugged off China’s Covid-inspired uncertainty.
- FOMC minutes will provide cues about the monetary policy outlook for CY2023.
- The Loonie bulls are likely to dance to the tunes of Canada’s employment data.
The pair currently trades last at 1.35522.
The previous day high was 1.3584 while the previous day low was 1.3525. The daily 38.2% Fib levels comes at 1.3561, expected to provide resistance. Similarly, the daily 61.8% fib level is at 1.3548, expected to provide support.
The USD/CAD pair has displayed a perpendicular downside move after testing the previous week’s high around 1.3606 in the early Asian session. The Lonnie asset has dropped vigorously to near 1.3545 and is expected to extend its downside journey as the risk-averse theme has lost its traction.
A value-buying context in the S&P500 futures has made the market mood cheerful in the Asian session. Also, risk-perceived currencies have gained positive traction. Meanwhile, the US Dollar Index (DXY) has turned sideways after a sheer drop to near 103.15. The USD index is hovering near its crucial support, therefore, sheer volatility is expected from the counter ahead.
Investors are shifting their focus toward the minutes of the Federal Open Market Committee (FOMC), which will release on Thursday, as it will disclose the rationale behind hiking the interest rates by 50 basis points (bps) and pushing them to 4.25%-4.50%. Federal Reserve (Fed) chair Jerome Powell has already cleared that interest rates will peak around 5.1%. Inflationary pressures in the United States are extremely stubborn, therefore, investors should expect the continuation of higher interest rates straight to the end of CY2023.
Meanwhile, Loonie investors are awaiting the release of Friday’s employment data. The Bank of Canada (BoC) may continue facing troubles as wage prices are escalating in the economy. Higher employment bills will keep inflation at elevated levels and may force BOC Governor Tiff Macklem to tighten policy further.
On the oil front, oil price are struggling to sustain above $80.00 as the street is expecting an increase in the number of Covid-19 infections ahead. Analysts at Capital Economics have warned that “China is entering the most dangerous weeks of the pandemic”.
Technical Levels: Supports and Resistances
USDCAD currently trading at 1.3554 at the time of writing. Pair opened at 1.3572 and is trading with a change of -0.13 % .
| Overview | Overview.1 | |
|---|---|---|
| 0 | Today last price | 1.3554 |
| 1 | Today Daily Change | -0.0018 |
| 2 | Today Daily Change % | -0.1300 |
| 3 | Today daily open | 1.3572 |
The pair is trading below its 20 Daily moving average @ 1.3606, above its 50 Daily moving average @ 1.3525 , above its 100 Daily moving average @ 1.3451 and above its 200 Daily moving average @ 1.3127
| Trends | Trends.1 | |
|---|---|---|
| 0 | Daily SMA20 | 1.3606 |
| 1 | Daily SMA50 | 1.3525 |
| 2 | Daily SMA100 | 1.3451 |
| 3 | Daily SMA200 | 1.3127 |
The previous day high was 1.3584 while the previous day low was 1.3525. The daily 38.2% Fib levels comes at 1.3561, expected to provide resistance. Similarly, the daily 61.8% fib level is at 1.3548, expected to provide support.
Note the levels of interest below:
- Pivot support is noted at 1.3537, 1.3502, 1.3478
- Pivot resistance is noted at 1.3596, 1.3619, 1.3654
| Levels | Levels.1 |
|---|---|
| Previous Daily High | 1.3584 |
| Previous Daily Low | 1.3525 |
| Previous Weekly High | 1.3612 |
| Previous Weekly Low | 1.3484 |
| Previous Monthly High | 1.3705 |
| Previous Monthly Low | 1.3385 |
| Daily Fibonacci 38.2% | 1.3561 |
| Daily Fibonacci 61.8% | 1.3548 |
| Daily Pivot Point S1 | 1.3537 |
| Daily Pivot Point S2 | 1.3502 |
| Daily Pivot Point S3 | 1.3478 |
| Daily Pivot Point R1 | 1.3596 |
| Daily Pivot Point R2 | 1.3619 |
| Daily Pivot Point R3 | 1.3654 |
[/s2If]
Join Our Telegram Group
")


