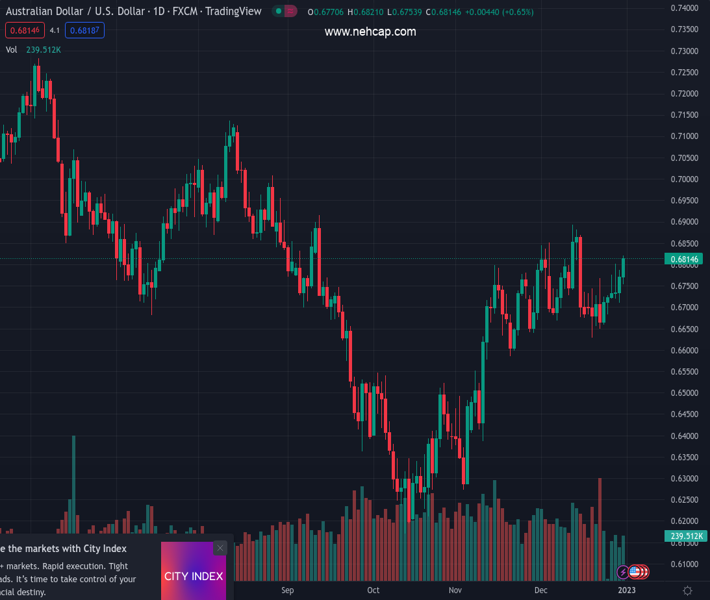
#AUDUSD @ 0.68060 is aiming to recapture the 0.6850 barrier as US Dollar Index has shifted into a bearish trajectory. (Pivot Orderbook analysis)
…
This is a premium post.
[s2If !current_user_can(access_s2member_level4)]Please register for PREMIUM VERSION HERE to read full post below containing analysis. In case of any error or you think you are not able to read the full post below, please email us at support#nehcap.com [lwa][/s2If] [s2If current_user_can(access_s2member_level4)]
- AUD/USD is aiming to recapture the 0.6850 barrier as US Dollar Index has shifted into a bearish trajectory.
- Higher interest rate hikes by the Federal Reserve might impact the ISM Manufacturing PMI.
- The release of the FOMC minutes on Thursday will provide a detailed explanation of December’s policy.
- AUD/USD is hoping for a continuation of a six-day winning streak after sustaining above 0.6800.
The pair currently trades last at 0.68060.
The previous day high was 0.6821 while the previous day low was 0.6753. The daily 38.2% Fib levels comes at 0.6795, expected to provide support. Similarly, the daily 61.8% fib level is at 0.6779, expected to provide support.
AUD/USD settled the last trading session of CY2022 on a promising note after the US Dollar Index (DXY) faced immense pressure. The Aussie asset continued its winning spree for the sixth day despite less trading activity due to the festive week. Usually, the overall trading activity gets reduced sharply amid a holiday-truncated week as investors prefer to save themselves from unexpected wild gyrations.
The Australian Dollar managed to remain in a positive trajectory despite the vulnerable Covid-19 situation in China. Covid-19 cases have spiked sharply and the situation is beyond the control of medical facilities. This has triggered short-term pain in the extent of economic activities.
Risk-perceived assets like S&P500 ended 2022 on a cautious note as analysts have mixed responses over economic projections. On contrary, the risk-sensitive currencies witnessed firmer demand from the market participants. The US Dollar Index (DXY) delivered a downside break of the consolidation formed in a 103.37-104.57 range. While the return on 10-year US Treasury bonds continued their strength and rose to near 3.88%.
Investors are keenly waiting for the release of the United States ISM Manufacturing PMI data, which will release on Wednesday. It is crucial to understand the change in the extent of economic activities as the Federal Reserve is continuously hiking interest rates. In December’s monetary policy meeting, Fed chair Jerome Powell hiked interest rates by 50 basis points (bps) to 4.25-4.50%. This has compelled firms to skip their expansion plans as interest obligations could be extremely higher in the current period of time.
According to the estimates, the US ISM Manufacturing PMI data is expected to improve to 49.6 from the former release of 49.0. Apart from that, investors will focus on New Orders Index data that provide cues about the forward demand in the United States economy. The economic data is seen higher at 48.1 vs. the former release of 47.2.
This week, the event of Federal Open Market Committee (FOMC) minutes will remain in the spotlight. The release of the FOMC minutes on Thursday will provide a detailed explanation of December’s monetary policy decision. Apart from that, the market participants will keep an eye on cues about economic projections and likely monetary policy action by Fed chair Jerome Powell ahead.
A scrutiny of Federal Reserve chair Jerome Powell’s speech in December’s monetary policy meeting clears that the central bank sees interest rate peak around 5.1%. Considering opinions from various Federal Reserve policymakers, the central bank will keep interest rates at their peak and continue for the entire CY2023 to achieve price stability.
The Chinese economy has attracted a significant decline in economic projections by think tanks after adopting a sheer pace in reopening the economy. After a firm protest by households for the rollback of lockdown restrictions, it seems necessary to check out the deviation in the figures from the prior release. As per the consensus, the Caixin Manufacturing PMI data is expected to drop marginally to 49.3 from the prior release of 49.4.
Observation from the Chinese official Manufacturing PMI shows a downbeat expression. Official China’s Manufacturing PMI data dropped to 47.0 vs. the expectations of 49.2 and the former release of 48.0.
On a four-hour scale, the Aussie asset is auctioning in a Rising Channel chart pattern, which is highly neutral as it has formed after a sell-off move from December 13 high around 0.6900. The round-level resistance of 0.6800 has remained a critical barrier for the Australian Dollar for the past 15 trading sessions.
A recovery move in the Aussie asset has pushed it above the 20-period Exponential Moving Average (EMA) around 0.6747. Also, the 200-EMA at 0.6700 is still solid, which indicates that the long-term trend is still bullish.
The Relative Strength Index (RSI) (14) is struggling to shift into the bullish range of 60.00-80.00. An occurrence of the same will trigger bullish momentum.
Technical Levels: Supports and Resistances
AUDUSD currently trading at 0.6807 at the time of writing. Pair opened at 0.6808 and is trading with a change of -0.01 % .
| Overview | Overview.1 | |
|---|---|---|
| 0 | Today last price | 0.6807 |
| 1 | Today Daily Change | -0.0001 |
| 2 | Today Daily Change % | -0.0100 |
| 3 | Today daily open | 0.6808 |
The pair is trading above its 20 Daily moving average @ 0.6738, above its 50 Daily moving average @ 0.6645 , above its 100 Daily moving average @ 0.6642 and below its 200 Daily moving average @ 0.6863
| Trends | Trends.1 | |
|---|---|---|
| 0 | Daily SMA20 | 0.6738 |
| 1 | Daily SMA50 | 0.6645 |
| 2 | Daily SMA100 | 0.6642 |
| 3 | Daily SMA200 | 0.6863 |
The previous day high was 0.6821 while the previous day low was 0.6753. The daily 38.2% Fib levels comes at 0.6795, expected to provide support. Similarly, the daily 61.8% fib level is at 0.6779, expected to provide support.
Note the levels of interest below:
- Pivot support is noted at 0.6767, 0.6726, 0.6698
- Pivot resistance is noted at 0.6835, 0.6863, 0.6904
| Levels | Levels.1 |
|---|---|
| Previous Daily High | 0.6821 |
| Previous Daily Low | 0.6753 |
| Previous Weekly High | 0.6821 |
| Previous Weekly Low | 0.6710 |
| Previous Monthly High | 0.6893 |
| Previous Monthly Low | 0.6629 |
| Daily Fibonacci 38.2% | 0.6795 |
| Daily Fibonacci 61.8% | 0.6779 |
| Daily Pivot Point S1 | 0.6767 |
| Daily Pivot Point S2 | 0.6726 |
| Daily Pivot Point S3 | 0.6698 |
| Daily Pivot Point R1 | 0.6835 |
| Daily Pivot Point R2 | 0.6863 |
| Daily Pivot Point R3 | 0.6904 |
[/s2If]
Join Our Telegram Group
")


