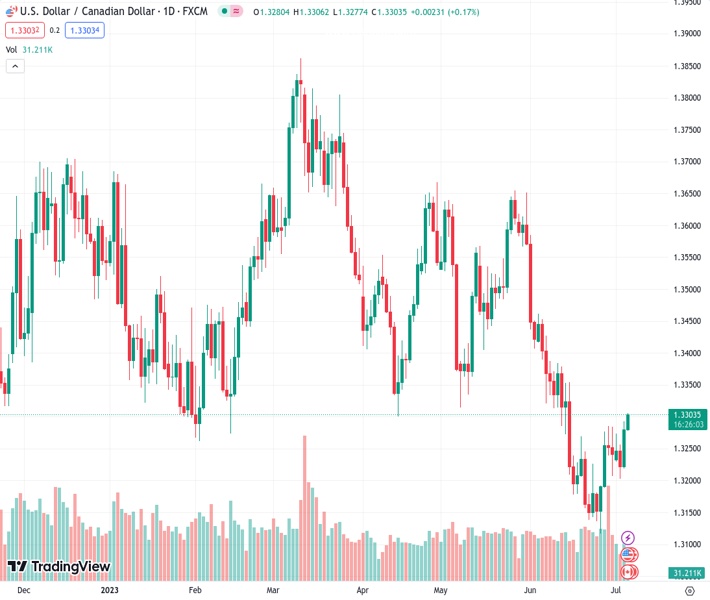
#USDCAD @ 1.33039 scales higher for the second straight day and hits a three-week high on Thursday.
…
This is a premium post.
[s2If !current_user_can(access_s2member_level4)]Please register for FREE REGISTER to read full post below containing analysis. In case of any error or you think you are not able to read the full post below, please email us at support#nehcap.com [lwa][/s2If] [s2If current_user_can(access_s2member_level1)]
- USD/CAD scales higher for the second straight day and hits a three-week high on Thursday.
The pair currently trades last at 1.33039.
The previous day high was 1.3293 while the previous day low was 1.322. The daily 38.2% Fib levels comes at 1.3265, expected to provide support. Similarly, the daily 61.8% fib level is at 1.3248, expected to provide support.
The USD/CAD pair attracts some buying for the second straight day on Thursday and touches a fresh three-week high during the Asian session, which bulls now awaiting a sustained move beyond the 1.33000 mark before placing fresh bets.
The US Dollar (USD) adds to its weekly gains and remains well supported by the Federal Reserve’s (Fed) hawkish outlook, which, in turn, is seen as a key factor acting as a tailwind for the USD/CAD pair. The US central bank, at its June policy meeting, opted for a pause to assess the impact of 10 previous rate hikes, though the minutes released Wednesday indicated a greater likelihood of further policy tightening. In fact, almost all members supported resuming rate hikes at a future meeting as inflation remains unacceptably high.
The prospects for further policy tightening by the Fed led to the overnight sharp rise in the US Treasury bond yields, which, along with a generally weaker risk tone, further benefit the safe-haven Greenback. The disappointing release of services data from China on Wednesday exacerbated worries about a global economic downturn. Apart from this, the potential risk of a further escalation in a trade conflict between China and the US – the world’s largest economies – tempers investors’ appetite for perceived riskier assets.
China introduced export curbs on two metals – widely used in semiconductors, electric vehicles and high-tech industries – to the US. The abrupt move is viewed as a response to efforts by the US to curtail China’s technological advancements and might cause more disruption to global trade. This takes its toll on the global risk sentiment and drives some haven flows towards the buck. That said, bullish Crude Oil prices underpin the commodity-linked Loonie and could act as a headwind for the USD/CAD pair, at least for the time being.
Market participants now look forward to the US economic docket – featuring the ADP report on private-sector employment, the usual Weekly Initial Jobless Claims, the ISM Services PMI and JOLTS Job Openings data. Apart from this, the US bond yields and the broader risk sentiment will drive the USD demand. This, along with Crude Oil price dynamics, should contribute to producing short-term trading opportunities around the USD/CAD pair ahead of the critical monthly jobs data from Canada and the US, due for release on Friday.
Technical Levels: Supports and Resistances
USDCAD currently trading at 1.3292 at the time of writing. Pair opened at 1.3281 and is trading with a change of 0.08 % .
| Overview | Overview.1 | |
|---|---|---|
| 0 | Today last price | 1.3292 |
| 1 | Today Daily Change | 0.0011 |
| 2 | Today Daily Change % | 0.0800 |
| 3 | Today daily open | 1.3281 |
The pair is trading above its 20 Daily moving average @ 1.3247, below its 50 Daily moving average @ 1.3402 , below its 100 Daily moving average @ 1.3491 and below its 200 Daily moving average @ 1.3507
| Trends | Trends.1 | |
|---|---|---|
| 0 | Daily SMA20 | 1.3247 |
| 1 | Daily SMA50 | 1.3402 |
| 2 | Daily SMA100 | 1.3491 |
| 3 | Daily SMA200 | 1.3507 |
The previous day high was 1.3293 while the previous day low was 1.322. The daily 38.2% Fib levels comes at 1.3265, expected to provide support. Similarly, the daily 61.8% fib level is at 1.3248, expected to provide support.
Note the levels of interest below:
- Pivot support is noted at 1.3236, 1.3192, 1.3163
- Pivot resistance is noted at 1.3309, 1.3338, 1.3382
| Levels | Levels.1 |
|---|---|
| Previous Daily High | 1.3293 |
| Previous Daily Low | 1.3220 |
| Previous Weekly High | 1.3285 |
| Previous Weekly Low | 1.3117 |
| Previous Monthly High | 1.3585 |
| Previous Monthly Low | 1.3117 |
| Daily Fibonacci 38.2% | 1.3265 |
| Daily Fibonacci 61.8% | 1.3248 |
| Daily Pivot Point S1 | 1.3236 |
| Daily Pivot Point S2 | 1.3192 |
| Daily Pivot Point S3 | 1.3163 |
| Daily Pivot Point R1 | 1.3309 |
| Daily Pivot Point R2 | 1.3338 |
| Daily Pivot Point R3 | 1.3382 |
[/s2If]
Nehcap Expert Advisor
The NEHCAP MT4 EA is high quality professional trading system geared to generate returns without using GRID or martingales. Each trade has strict risk per trade parameter. The pairs under management include EURUSD, GBPUSD, AUDCAD, AUDNZD,GBPAUD, EURAUD, EURCAD, CHFJPY and many more.
The system is trading live: LIVE ACCOUNT TRACKING
You can run it free. Apply for a free trial and track our account. Buy the system or use profit share mechanism to generate returns on your MT4.
Join Our Telegram Group
")


