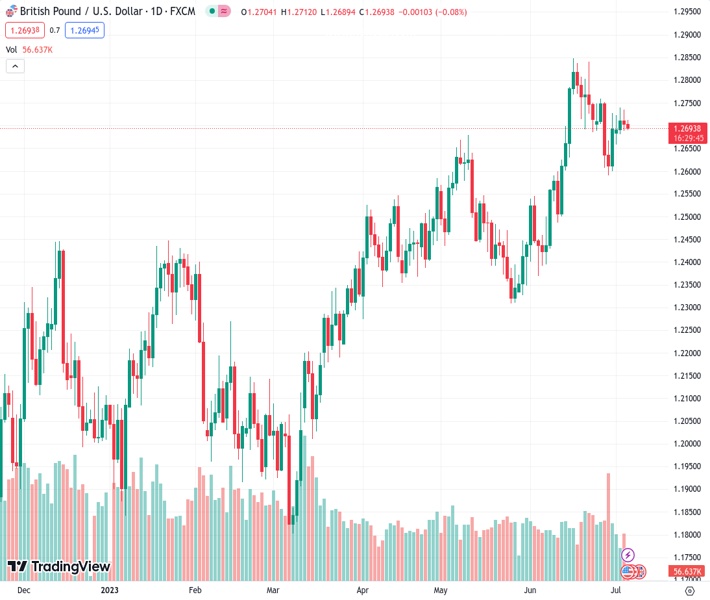
The GBPUSD pair at a rate of 1.26935 does not show any clear direction during the day and moves back and forth within a small range on Friday.
…
This is a premium post.
[s2If !current_user_can(access_s2member_level4)]Please register for FREE REGISTER to read full post below containing analysis. In case of any error or you think you are not able to read the full post below, please email us at support#nehcap.com [lwa][/s2If] [s2If current_user_can(access_s2member_level1)]
- GBP/USD lacks any firm intraday direction and oscillates in a narrow range on Friday.
The pair currently trades last at 1.26935.
The previous day high was 1.2736 while the previous day low was 1.2688. The daily 38.2% Fib levels comes at 1.2706, expected to provide resistance. Similarly, the daily 61.8% fib level is at 1.2717, expected to provide resistance.
The GBP/USD pair struggles to gain any meaningful traction and seesaws between tepid gains/minor losses during the Asian session on Thursday. Spot prices, however, manage to defend the 200-hour Simple Moving Average (SMA) and currently trade around the 1.2700 mark, nearly unchanged for the day.
The prospects for further policy tightening by the Federal Reserve (Fed) push the US Dollar (USD) to a fresh weekly high, which, in turn, acts as a headwind for the GBP/USD pair. In fact, minutes from the June FOMC policy meeting released on Wednesday showed that almost all members supported resuming rate hikes as inflation remains unacceptably high. Furthermore, some members were in Favor of raising rates rather than pausing at the June meeting, flagging a very tight labor market that threatens to push wages and inflation higher.
The hawkish outlook reaffirms market bets for a 25 bps lift-off at the upcoming FOMC meeting on July 25-26 and led to the overnight sharp rise in the US Treasury bond yields. Apart from this, a generally weaker risk tone further benefits the safe-haven Greenback and should contribute to keeping a lid on any meaningful upside for the GBP/USD pair. Against the backdrop of worries about a global economic downturn, the risk of a further escalation in a trade conflict between China and the US tempers investors’ appetite for perceived riskier assets.
Apart from this, fears that more aggressive interest rate hikes by the Bank of England (BoE) could push the UK economy into recession suggests that the path of least resistance for the GBP/USD pair is to the downside. In fact, the markets are currently pricing in the possibility of a further 130 bps of tightening through to the turn of the year. Moreover, BoE Governor Andrew Bailey last week justified the decision to hike interest rates by a jumbo 50 bps on June 22 and said that rates could remain at peak levels for longer than traders currently expect.
The aforementioned fundamental backdrop warrants some caution before positioning for an extension of the recent bounce from sub-1.2600 levels touched last week. Market participants now look to the UK Construction PMI for some impetus ahead of the US economic docket – featuring the ADP report on private-sector employment, the usual Weekly Initial Jobless Claims, the ISM Services PMI and JOLTS Job Openings data. The focus, however, remains glued to the closely-watched US monthly jobs data – popularly known as the NFP report on Friday.
Technical Levels: Supports and Resistances
GBPUSD currently trading at 1.2708 at the time of writing. Pair opened at 1.2704 and is trading with a change of 0.03 % .
| Overview | Overview.1 | |
|---|---|---|
| 0 | Today last price | 1.2708 |
| 1 | Today Daily Change | 0.0004 |
| 2 | Today Daily Change % | 0.0300 |
| 3 | Today daily open | 1.2704 |
The pair remains strongly bullish on the daily timeframe. It trades above its 20 SMA @ 1.2692, 50 SMA 1.2564, 100 SMA @ 1.2397 and 200 SMA @ 1.2141.
| Trends | Trends.1 | |
|---|---|---|
| 0 | Daily SMA20 | 1.2692 |
| 1 | Daily SMA50 | 1.2564 |
| 2 | Daily SMA100 | 1.2397 |
| 3 | Daily SMA200 | 1.2141 |
The previous day high was 1.2736 while the previous day low was 1.2688. The daily 38.2% Fib levels comes at 1.2706, expected to provide resistance. Similarly, the daily 61.8% fib level is at 1.2717, expected to provide resistance.
Note the levels of interest below:
- Pivot support is noted at 1.2683, 1.2662, 1.2636
- Pivot resistance is noted at 1.273, 1.2757, 1.2778
| Levels | Levels.1 |
|---|---|
| Previous Daily High | 1.2736 |
| Previous Daily Low | 1.2688 |
| Previous Weekly High | 1.2760 |
| Previous Weekly Low | 1.2591 |
| Previous Monthly High | 1.2848 |
| Previous Monthly Low | 1.2369 |
| Daily Fibonacci 38.2% | 1.2706 |
| Daily Fibonacci 61.8% | 1.2717 |
| Daily Pivot Point S1 | 1.2683 |
| Daily Pivot Point S2 | 1.2662 |
| Daily Pivot Point S3 | 1.2636 |
| Daily Pivot Point R1 | 1.2730 |
| Daily Pivot Point R2 | 1.2757 |
| Daily Pivot Point R3 | 1.2778 |
[/s2If]
Nehcap Expert Advisor
The NEHCAP MT4 EA is high quality professional trading system geared to generate returns without using GRID or martingales. Each trade has strict risk per trade parameter. The pairs under management include EURUSD, GBPUSD, AUDCAD, AUDNZD,GBPAUD, EURAUD, EURCAD, CHFJPY and many more.
The system is trading live: LIVE ACCOUNT TRACKING
You can run it free. Apply for a free trial and track our account. Buy the system or use profit share mechanism to generate returns on your MT4.
Join Our Telegram Group
")


