The USD to INR exchange rate rises for the third consecutive day and reaches a high not seen in several weeks on Thursday.
…
This is a premium post.
[s2If !current_user_can(access_s2member_level4)]Please register for FREE REGISTER to read full post below containing analysis. In case of any error or you think you are not able to read the full post below, please email us at support#nehcap.com [lwa][/s2If] [s2If current_user_can(access_s2member_level1)]
- USD/INR scales higher for the third straight day and climbs to a multi-week high on Thursday.
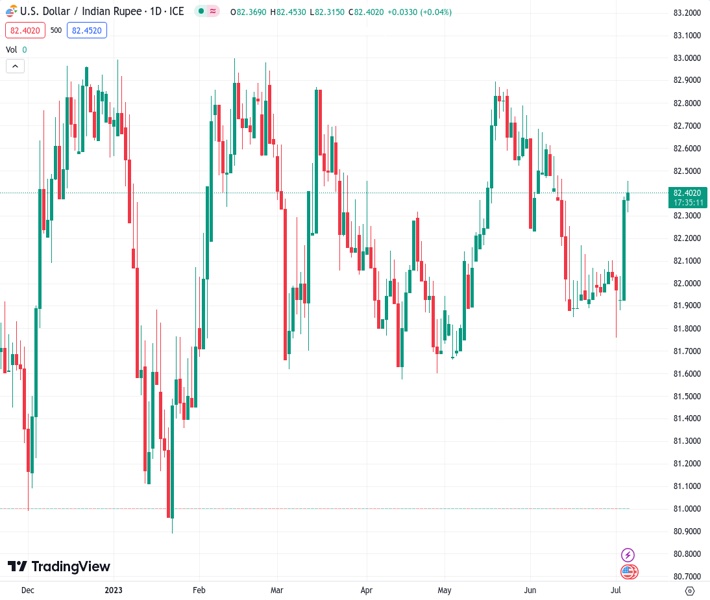
The pair currently trades last at 82.4404.
The previous day high was 82.4436 while the previous day low was 81.9735. The daily 38.2% Fib levels comes at 82.2641, expected to provide support. Similarly, the daily 61.8% fib level is at 82.1531, expected to provide support.
The USD/INR pair attracts some buying for the third successive day on Thursday and climbs to over a three-week high during the Asian session. Spot prices currently trade just below mid-82.00s, up less than 0.10% for the day, and seem poised to build on the recent strong recovery from the 81.75 region, or the lowest level since May 8 touched on Monday.
The overnight sustained strength beyond the top end of a multi-week-old trading range, which coincided with a technically significant 200-day Simple Moving Average (SMA), was seen as a fresh trigger for bullish traders. Moreover, oscillators on the daily chart have been gaining positive traction and are still far from being in the overbought zone. This, in turn, validates the positive outlook for the USD/INR pair.
From current levels, the 82.70-82.75 region is likely to act as an immediate resistance, above which spot prices could make a fresh attempt to conquer the 83.00 round figure. The said handle has been acting as a strong barrier since October 2022. Hence, some follow-through buying will mark a fresh bullish breakout and pave the way for a further near-term appreciating move for the USD/INR pair.
On the flip side, the 200-day SMA, around the 82.25 region, now seems to protect the immediate downside ahead of the 82.00 mark. This is followed by the monthly low, around the 81.75 zone, which if broken decisively will shift the bias in favour of bearish traders. The USD/INR pair might then accelerate the slide towards the 81.50 support before dropping to test sub-81.00 levels or the YTD low touched in January.
Technical Levels: Supports and Resistances
USDINR currently trading at 82.4285 at the time of writing. Pair opened at 82.3929 and is trading with a change of 0.04 % .
| Overview | Overview.1 | |
|---|---|---|
| 0 | Today last price | 82.4285 |
| 1 | Today Daily Change | 0.0356 |
| 2 | Today Daily Change % | 0.0400 |
| 3 | Today daily open | 82.3929 |
The pair remains strongly bullish on the daily timeframe. It trades above its 20 SMA @ 82.0913, 50 SMA 82.2187, 100 SMA @ 82.2361 and 200 SMA @ 82.1602.
| Trends | Trends.1 | |
|---|---|---|
| 0 | Daily SMA20 | 82.0913 |
| 1 | Daily SMA50 | 82.2187 |
| 2 | Daily SMA100 | 82.2361 |
| 3 | Daily SMA200 | 82.1602 |
The previous day high was 82.4436 while the previous day low was 81.9735. The daily 38.2% Fib levels comes at 82.2641, expected to provide support. Similarly, the daily 61.8% fib level is at 82.1531, expected to provide support.
Note the levels of interest below:
- Pivot support is noted at 82.0964, 81.7999, 81.6262
- Pivot resistance is noted at 82.5665, 82.7402, 83.0367
| Levels | Levels.1 |
|---|---|
| Previous Daily High | 82.4436 |
| Previous Daily Low | 81.9735 |
| Previous Weekly High | 82.2590 |
| Previous Weekly Low | 81.9393 |
| Previous Monthly High | 82.7370 |
| Previous Monthly Low | 81.8477 |
| Daily Fibonacci 38.2% | 82.2641 |
| Daily Fibonacci 61.8% | 82.1531 |
| Daily Pivot Point S1 | 82.0964 |
| Daily Pivot Point S2 | 81.7999 |
| Daily Pivot Point S3 | 81.6262 |
| Daily Pivot Point R1 | 82.5665 |
| Daily Pivot Point R2 | 82.7402 |
| Daily Pivot Point R3 | 83.0367 |
[/s2If]
Nehcap Expert Advisor
The NEHCAP MT4 EA is high quality professional trading system geared to generate returns without using GRID or martingales. Each trade has strict risk per trade parameter. The pairs under management include EURUSD, GBPUSD, AUDCAD, AUDNZD,GBPAUD, EURAUD, EURCAD, CHFJPY and many more.
The system is trading live: LIVE ACCOUNT TRACKING
You can run it free. Apply for a free trial and track our account. Buy the system or use profit share mechanism to generate returns on your MT4.
Join Our Telegram Group
")


