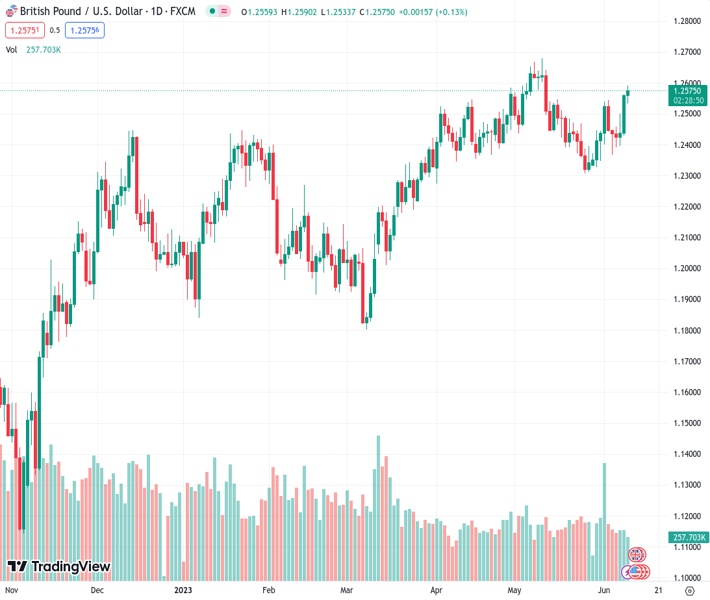
#GBPUSD @ 1.25759 rebounds from weekly lows to a four-week high of 1.2590. (Pivot Orderbook analysis)
…
This is a premium post.
[s2If !current_user_can(access_s2member_level4)]Please register for FREE REGISTER to read full post below containing analysis. In case of any error or you think you are not able to read the full post below, please email us at support#nehcap.com [lwa][/s2If] [s2If current_user_can(access_s2member_level1)]
- GBP/USD rebounds from weekly lows to a four-week high of 1.2590.
- Swaps market pricing suggests a further 100bps hike by the BoE.
- Key events next week include UK labor market data, GDP figures, and US Fed monetary policy meeting.
The pair currently trades last at 1.25759.
The previous day high was 1.2561 while the previous day low was 1.2433. The daily 38.2% Fib levels comes at 1.2512, expected to provide support. Similarly, the daily 61.8% fib level is at 1.2482, expected to provide support.
GBP/USD climbed to a new four-week high at 1.2590 on Friday. However, it dipped toward the 1.2570s area after a softer-than-estimated Canadian jobs report cemented the case for a Federal Reserve skip in the upcoming monetary policy meeting. The GBP/USD is trading at 1.2576, up 0.14%, set to finish the week with gains of more than 1%.
Market sentiment is upbeat and pressures safe-haven peers, meaning the US Dollar (USD) trades soft. That, alongside central banks’ divergence between the US Federal Reserve (Fed) and the Bank of England (BoE), favors the Pound Sterling (GBP), with the GBP/USD bouncing from weekly lows of 1.2368.
Next week, Fed Chair Jerome Powell and his colleagues will reveal their fourth decision about monetary policy. The Fed is expected to keep rates at 5.00%-5.25% unchanged compared to May’s meeting, as policymakers would like to see the impact of 500 bps of tightening since March 2022. However, recent hawkish moves delivered by two major central banks that paused their tightening cycles opened the door for a possible hike.
The International Monetary Fund (IMF) urged the Fed and other global central banks to “stay the course” on monetary policy tightening as they scramble to temper inflation.
Aside from this, the UK dodged a recession projected by the Bank of England (BoE) yet is still battling stubbornly high inflation that peaked at 11.1% in October last year. Since then, it has retreated to 8.7%, urging the BoE to raise rates above comfortable levels.
That underpins the GBP/USD, which is set to test the 1.2600 figure, as the swaps markets currently pricing in the BoE will increase rates in the UK up to 5.50%, 100 basis points (bps) higher than current levels.
Upcoming events
Next week, the UK economic calendar will feature labor market data and the Gross Domestic Product (GDP) as the week’s highlights. Across the pond, the Federal Reserve (Fed) monetary policy meeting, the Consumer Price Index (CPI), and Retail Sales would update the status of the US economy.
Given the fundamental backdrop, the GBP/USD remains upward biased, set to test 1.2600, as the uptrend accelerates, as shown by the latest upslope trendline drawn from May 30 lows. If GBP/USD clears 1.2600, the May 11 high emerges as the next resistance at 1.2641, ahead of reaching the YTD high at 1.2680. The break above will expose 1.2700. Conversely, the GBP/USD first support would be June 2 high-turned support at 1.2544 before diving towards a broken resistance trendline and the 1.2500 figure confluence.
Technical Levels: Supports and Resistances
GBPUSD currently trading at 1.2578 at the time of writing. Pair opened at 1.256 and is trading with a change of 0.14 % .
| Overview | Overview.1 | |
|---|---|---|
| 0 | Today last price | 1.2578 |
| 1 | Today Daily Change | 0.0018 |
| 2 | Today Daily Change % | 0.1400 |
| 3 | Today daily open | 1.2560 |
The pair remains strongly bullish on the daily timeframe. It trades above its 20 SMA @ 1.2437, 50 SMA 1.2464, 100 SMA @ 1.2307 and 200 SMA @ 1.2011.
| Trends | Trends.1 | |
|---|---|---|
| 0 | Daily SMA20 | 1.2437 |
| 1 | Daily SMA50 | 1.2464 |
| 2 | Daily SMA100 | 1.2307 |
| 3 | Daily SMA200 | 1.2011 |
The previous day high was 1.2561 while the previous day low was 1.2433. The daily 38.2% Fib levels comes at 1.2512, expected to provide support. Similarly, the daily 61.8% fib level is at 1.2482, expected to provide support.
Note the levels of interest below:
- Pivot support is noted at 1.2475, 1.239, 1.2347
- Pivot resistance is noted at 1.2603, 1.2646, 1.2731
| Levels | Levels.1 |
|---|---|
| Previous Daily High | 1.2561 |
| Previous Daily Low | 1.2433 |
| Previous Weekly High | 1.2545 |
| Previous Weekly Low | 1.2327 |
| Previous Monthly High | 1.2680 |
| Previous Monthly Low | 1.2308 |
| Daily Fibonacci 38.2% | 1.2512 |
| Daily Fibonacci 61.8% | 1.2482 |
| Daily Pivot Point S1 | 1.2475 |
| Daily Pivot Point S2 | 1.2390 |
| Daily Pivot Point S3 | 1.2347 |
| Daily Pivot Point R1 | 1.2603 |
| Daily Pivot Point R2 | 1.2646 |
| Daily Pivot Point R3 | 1.2731 |
[/s2If]
Nehcap Expert Advisor
The NEHCAP MT4 EA is high quality professional trading system geared to generate returns without using GRID or martingales. Each trade has strict risk per trade parameter. The pairs under management include EURUSD, GBPUSD, AUDCAD, AUDNZD,GBPAUD, EURAUD, EURCAD, CHFJPY and many more.
The system is trading live: LIVE ACCOUNT TRACKING
You can run it free. Apply for a free trial and track our account. Buy the system or use profit share mechanism to generate returns on your MT4.
Join Our Telegram Group
")


