#USDJPY @ 139.349 rallies following soft Canadian jobs data and surge in US Treasury bond yields. (Pivot Orderbook analysis)
…
This is a premium post.
[s2If !current_user_can(access_s2member_level4)]Please register for FREE REGISTER to read full post below containing analysis. In case of any error or you think you are not able to read the full post below, please email us at support#nehcap.com [lwa][/s2If] [s2If current_user_can(access_s2member_level1)]
- USD/JPY rallies following soft Canadian jobs data and surge in US Treasury bond yields.
- Bullish engulfing candlestick pattern forms a base for potential upside.
- Technical indicators suggest buying momentum as USD/JPY challenges the 140.00 resistance level.
The pair currently trades last at 139.349.
The previous day high was 140.23 while the previous day low was 138.81. The daily 38.2% Fib levels comes at 139.35, expected to provide resistance. Similarly, the daily 61.8% fib level is at 139.69, expected to provide resistance.
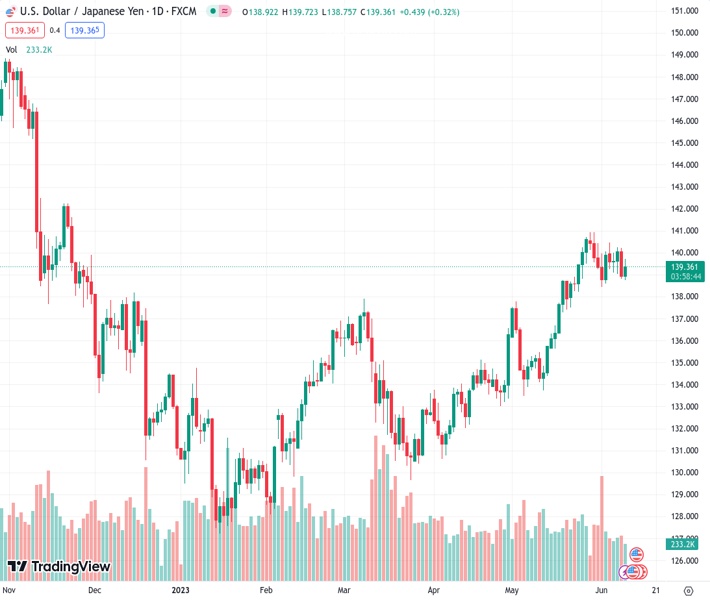
USD/JPY bounced off weekly lows, and the 20-day Exponential Moving Average (EMA) confluence on Friday after soft jobs data from Canada spurred a jump in US Treasury bond yields. The USD/JPY is trading at 139.37, up 0.32%.
After rallying toward new year-to-date (YTD) highs of 140.91 towards the end of May, the USD/JPY dipped towards 138.40, as threats of a possible intervention by Japanese authorities triggered four consecutive days of losses. Amidst those plays, US Treasury bond yields, edging lower, added another reason to the downturn. Since then, a bullish engulfing candlestick pattern formed, creating a base at around the 138.40s area, which was tested on Thursday, but sellers failing to crack below the 20-day EMA at 138.69, kept support intact, as buyers get ready for an assault toward 140.00.
Another factor that supports the USD/JPY moving upwards is the Relative Strength Index (RSI) indicator, which sits in bullish territory, while the three-day Rate of Change (RoC) suggests buyers gathering momentum as the RoC approaches neutral levels.
Therefore, USD/JPY’s first resistance would be 140.00. A breach of the latter will expose the weekly high at 140.45, ahead of challenging the YTD high at 140.91. On the other hand, a dip below 139.00 could open the door to test the bottom of the abovementioned range at around 138.40.
Technical Levels: Supports and Resistances
USDJPY currently trading at 139.3 at the time of writing. Pair opened at 138.92 and is trading with a change of 0.27 % .
| Overview | Overview.1 | |
|---|---|---|
| 0 | Today last price | 139.30 |
| 1 | Today Daily Change | 0.38 |
| 2 | Today Daily Change % | 0.27 |
| 3 | Today daily open | 138.92 |
The pair remains strongly bullish on the daily timeframe. It trades above its 20 SMA @ 138.83, 50 SMA 135.92, 100 SMA @ 134.4 and 200 SMA @ 137.3.
| Trends | Trends.1 | |
|---|---|---|
| 0 | Daily SMA20 | 138.83 |
| 1 | Daily SMA50 | 135.92 |
| 2 | Daily SMA100 | 134.40 |
| 3 | Daily SMA200 | 137.30 |
The previous day high was 140.23 while the previous day low was 138.81. The daily 38.2% Fib levels comes at 139.35, expected to provide resistance. Similarly, the daily 61.8% fib level is at 139.69, expected to provide resistance.
Note the levels of interest below:
- Pivot support is noted at 138.41, 137.9, 136.99
- Pivot resistance is noted at 139.83, 140.74, 141.25
| Levels | Levels.1 |
|---|---|
| Previous Daily High | 140.23 |
| Previous Daily Low | 138.81 |
| Previous Weekly High | 140.93 |
| Previous Weekly Low | 138.43 |
| Previous Monthly High | 140.93 |
| Previous Monthly Low | 133.50 |
| Daily Fibonacci 38.2% | 139.35 |
| Daily Fibonacci 61.8% | 139.69 |
| Daily Pivot Point S1 | 138.41 |
| Daily Pivot Point S2 | 137.90 |
| Daily Pivot Point S3 | 136.99 |
| Daily Pivot Point R1 | 139.83 |
| Daily Pivot Point R2 | 140.74 |
| Daily Pivot Point R3 | 141.25 |
[/s2If]
Nehcap Expert Advisor
The NEHCAP MT4 EA is high quality professional trading system geared to generate returns without using GRID or martingales. Each trade has strict risk per trade parameter. The pairs under management include EURUSD, GBPUSD, AUDCAD, AUDNZD,GBPAUD, EURAUD, EURCAD, CHFJPY and many more.
The system is trading live: LIVE ACCOUNT TRACKING
You can run it free. Apply for a free trial and track our account. Buy the system or use profit share mechanism to generate returns on your MT4.
Join Our Telegram Group
")


