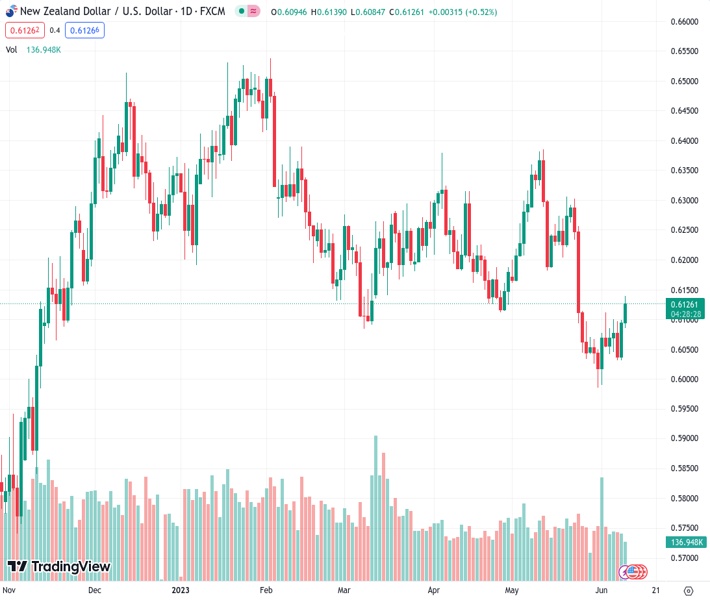
#NZDUSD @ 0.61260 The rose to its highest level since late May, above the 20-day SMA at 0.6130. (Pivot Orderbook analysis)
…
This is a premium post.
[s2If !current_user_can(access_s2member_level4)]Please register for FREE REGISTER to read full post below containing analysis. In case of any error or you think you are not able to read the full post below, please email us at support#nehcap.com [lwa][/s2If] [s2If current_user_can(access_s2member_level1)]
- The NZD/USD rose to its highest level since late May, above the 20-day SMA at 0.6130.
- ANZ predicts next week New Zealand GDP data will come in mixed.
- NZD/USD to close a second consecutive week of gains.
The pair currently trades last at 0.61260.
The previous day high was 0.61 while the previous day low was 0.6026. The daily 38.2% Fib levels comes at 0.6072, expected to provide support. Similarly, the daily 61.8% fib level is at 0.6055, expected to provide support.
The NZD/USD currency pair has recently surged to its highest level since May, surpassing the 20-day Simple Moving Average (SMA) at 0.6130. The Greenback’s losses for the next sessions could be limited by hawkish bets for the upcoming Federal Reserve (Fed) meeting past June, as recent development made investors foresee fewer odds of a rate cut by year-end.
Ahead of the upcoming Federal Reserve (Fed) June 13-14 meeting, the CME FedWatch Tool suggests that investors are placing higher probabilities on the Fed refraining from hiking rates and, instead, keeping the target rate steady at 5.00%-5.25%. However, the bets for a hike in July stand almost priced in at 85% and the odds of a rate cut by years-end decreased from 50% at the start of the week to nearly 15% due to the recent unexpected hikes by the Reserve Bank of Australia (RBA) and the Bank of Canada (BoC). In that sense, a more hawkish stance by the Fed provides support for the USD.
On the other hand, following NZ Q1 Gross Domestic Product (GDP) data release, ANZ Bank is expecting next week to see “tepid” growth and an improvement from the current account deficit.
Technically speaking, the NZD/USD exchange rate holds a neutral to bullish outlook for the short term as daily indicators show that bulls continue to get momentum. However, the pair needs to consolidate above the 20-day SMA in order to confirm a recovery. On the weekly chart, the pair is poised to confirm a second consecutive week of gains.
A consolidation above the 20-day Simple Moving Average at 0.6130 would suggest a continuation of the momentum towards the 200-day SMA at 0.6150 and then to the 0.6200 area. On the other hand, the 0.6090 area is the immediate support level for NZD/USD. A break below could pave the way towards the 0.6050 and 0.6030 zones.
Technical Levels: Supports and Resistances
NZDUSD currently trading at 0.613 at the time of writing. Pair opened at 0.6095 and is trading with a change of 0.57 % .
| Overview | Overview.1 | |
|---|---|---|
| 0 | Today last price | 0.6130 |
| 1 | Today Daily Change | 0.0035 |
| 2 | Today Daily Change % | 0.5700 |
| 3 | Today daily open | 0.6095 |
The pair is trading above its 20 Daily moving average @ 0.6128, below its 50 Daily moving average @ 0.6191 , below its 100 Daily moving average @ 0.6237 and below its 200 Daily moving average @ 0.6149
| Trends | Trends.1 | |
|---|---|---|
| 0 | Daily SMA20 | 0.6128 |
| 1 | Daily SMA50 | 0.6191 |
| 2 | Daily SMA100 | 0.6237 |
| 3 | Daily SMA200 | 0.6149 |
The previous day high was 0.61 while the previous day low was 0.6026. The daily 38.2% Fib levels comes at 0.6072, expected to provide support. Similarly, the daily 61.8% fib level is at 0.6055, expected to provide support.
Note the levels of interest below:
- Pivot support is noted at 0.6047, 0.6, 0.5973
- Pivot resistance is noted at 0.6122, 0.6148, 0.6196
| Levels | Levels.1 |
|---|---|
| Previous Daily High | 0.6100 |
| Previous Daily Low | 0.6026 |
| Previous Weekly High | 0.6112 |
| Previous Weekly Low | 0.5985 |
| Previous Monthly High | 0.6385 |
| Previous Monthly Low | 0.5985 |
| Daily Fibonacci 38.2% | 0.6072 |
| Daily Fibonacci 61.8% | 0.6055 |
| Daily Pivot Point S1 | 0.6047 |
| Daily Pivot Point S2 | 0.6000 |
| Daily Pivot Point S3 | 0.5973 |
| Daily Pivot Point R1 | 0.6122 |
| Daily Pivot Point R2 | 0.6148 |
| Daily Pivot Point R3 | 0.6196 |
[/s2If]
Nehcap Expert Advisor
The NEHCAP MT4 EA is high quality professional trading system geared to generate returns without using GRID or martingales. Each trade has strict risk per trade parameter. The pairs under management include EURUSD, GBPUSD, AUDCAD, AUDNZD,GBPAUD, EURAUD, EURCAD, CHFJPY and many more.
The system is trading live: LIVE ACCOUNT TRACKING
You can run it free. Apply for a free trial and track our account. Buy the system or use profit share mechanism to generate returns on your MT4.
Join Our Telegram Group
")


