#USDCAD @ 1.33220 is expected to show a vertical decline below 1.3320 as the upside in the USD index seems restricted. (Pivot Orderbook analysis)
…
This is a premium post.
[s2If !current_user_can(access_s2member_level4)]Please register for FREE REGISTER to read full post below containing analysis. In case of any error or you think you are not able to read the full post below, please email us at support#nehcap.com [lwa][/s2If] [s2If current_user_can(access_s2member_level1)]
- USD/CAD is expected to show a vertical decline below 1.3320 as the upside in the USD index seems restricted.
- The Canadian Dollar is struggling to firm its feet ahead of Canada’s Employment data.
- The US labor market is easing some heat and allowing the Fed to strictly consider a neutral interest rate policy.
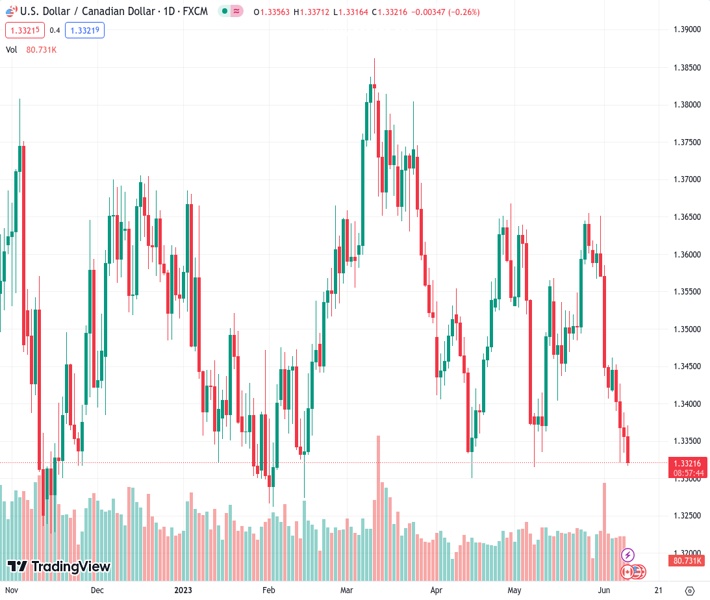
The pair currently trades last at 1.33220.
The previous day high was 1.3388 while the previous day low was 1.3334. The daily 38.2% Fib levels comes at 1.3355, expected to provide resistance. Similarly, the daily 61.8% fib level is at 1.3367, expected to provide resistance.
The USD/CAD pair is expected to deliver a perpendicular fall after a breakdown of the crucial support of 1.3320 in the European session. The Loonie asset is struggling in maintaining its strength ahead of Canada’s Employment data (May).
S&P500 futures have recovered significant losses added in early London, portraying a solid recovery in the risk appetite of the market participants. The US Dollar Index (DXY) is facing barricades while extending its recovery to near 103.60. It seems that the recovery move in the USD Index is expected to conclude as it was not backed with any fundamental support.
On Thursday, a heavy sell-off was recorded in the USD Index after the United States Department of Labor reported a sharp rise in individuals applying for Initial Jobless Claims for the week ending June 02. Jobless claims soared by 28K to 261K vs. the estimates of 235K. This indicated that the tight US labor market is easing some heat and allowing the Federal Reserve (Fed) to strictly consider a neutral interest rate policy.
On the Canadian Dollar front, Employment data will be keenly watched. Analysts at TD Securities expect job growth to slow to 25K in May for a deceleration from the recent trend of 57K, keeping the Unemployment Rate stable at 5.0%. We look for service-sector hiring to drive the headline print, alongside a rebound in full-time employment after the pullback in April. We also look for wage growth to remain elevated at 5.1%, down 0.1pp from last month.
Meanwhile, the oil price is facing difficulties while approaching near $72.00 amid a bleak oil demand outlook. The deflation situation in China showed that domestic demand is extremely weak. Also, the overall demand in the US economy looks vulnerable as their factory activity is consistently contracting.
It is worth noting that Canada is the leading exporter of oil to the United States and the weak oil price could impact the Canadian Dollar.
Technical Levels: Supports and Resistances
USDCAD currently trading at 1.3324 at the time of writing. Pair opened at 1.3358 and is trading with a change of -0.25 % .
| Overview | Overview.1 | |
|---|---|---|
| 0 | Today last price | 1.3324 |
| 1 | Today Daily Change | -0.0034 |
| 2 | Today Daily Change % | -0.2500 |
| 3 | Today daily open | 1.3358 |
The pair remains strongly bearish on the daily time frame. It trades below the 20 SMA @ 1.3502, 50 SMA 1.3491, 100 SMA @ 1.3516 and 200 SMA @ 1.3513.
| Trends | Trends.1 | |
|---|---|---|
| 0 | Daily SMA20 | 1.3502 |
| 1 | Daily SMA50 | 1.3491 |
| 2 | Daily SMA100 | 1.3516 |
| 3 | Daily SMA200 | 1.3513 |
The previous day high was 1.3388 while the previous day low was 1.3334. The daily 38.2% Fib levels comes at 1.3355, expected to provide resistance. Similarly, the daily 61.8% fib level is at 1.3367, expected to provide resistance.
Note the levels of interest below:
- Pivot support is noted at 1.3332, 1.3306, 1.3278
- Pivot resistance is noted at 1.3386, 1.3414, 1.344
| Levels | Levels.1 |
|---|---|
| Previous Daily High | 1.3388 |
| Previous Daily Low | 1.3334 |
| Previous Weekly High | 1.3651 |
| Previous Weekly Low | 1.3407 |
| Previous Monthly High | 1.3655 |
| Previous Monthly Low | 1.3315 |
| Daily Fibonacci 38.2% | 1.3355 |
| Daily Fibonacci 61.8% | 1.3367 |
| Daily Pivot Point S1 | 1.3332 |
| Daily Pivot Point S2 | 1.3306 |
| Daily Pivot Point S3 | 1.3278 |
| Daily Pivot Point R1 | 1.3386 |
| Daily Pivot Point R2 | 1.3414 |
| Daily Pivot Point R3 | 1.3440 |
[/s2If]
Nehcap Expert Advisor
The NEHCAP MT4 EA is high quality professional trading system geared to generate returns without using GRID or martingales. Each trade has strict risk per trade parameter. The pairs under management include EURUSD, GBPUSD, AUDCAD, AUDNZD,GBPAUD, EURAUD, EURCAD, CHFJPY and many more.
The system is trading live: LIVE ACCOUNT TRACKING
You can run it free. Apply for a free trial and track our account. Buy the system or use profit share mechanism to generate returns on your MT4.
Join Our Telegram Group
")


