#EURUSD @ 1.07651 has witnessed exhaustion in the upside momentum amid a recovery in the USD Index. (Pivot Orderbook analysis)
…
This is a premium post.
[s2If !current_user_can(access_s2member_level4)]Please register for FREE REGISTER to read full post below containing analysis. In case of any error or you think you are not able to read the full post below, please email us at support#nehcap.com [lwa][/s2If] [s2If current_user_can(access_s2member_level1)]
- EUR/USD has witnessed exhaustion in the upside momentum amid a recovery in the USD Index.
- The ECB will keep raising rates further even at the cost of Eurozone’s economic prospects.
- The recovery move in the EUR/USD has pushed it above the 61.8% Fibo retracement at 1.0738.
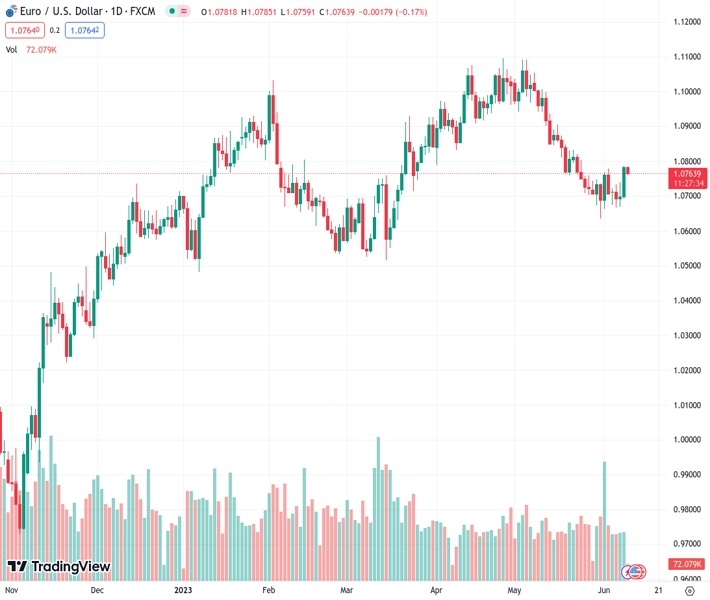
The pair currently trades last at 1.07651.
The previous day high was 1.0787 while the previous day low was 1.0696. The daily 38.2% Fib levels comes at 1.0752, expected to provide support. Similarly, the daily 61.8% fib level is at 1.0731, expected to provide support.
The EUR/USD pair has displayed an exhaustion in the upside momentum after reaching to near 1.0780 in the European session. The major currency pair has met an intermediate resistance due to an extension in the recovery by the US Dollar Index (DXY).
The USD Index has stretched its recovery to near 103.60, however, the downside seems favored as the United States labor market conditions are easing now and providing room for keeping interest rates steady by the Federal Reserve (Fed) in May.
A corrective move in the Euro could conclude sooner as the European Central Bank (ECB) is expected to raise interest rates further despite deepening fears of a recession in Eurozone.
The recovery move in the EUR/USD has pushed it above the 61.8% Fibonacci retracement (plotted from March 15 low at 1.0516 to April 26 high at 1.1095) at 1.0738. For a strong build-up of positive sentiment, the Euro has to pass through plenty of filters.
A bull cross, represented by the 20-and 50-period Exponential Moving Averages (EMAs) at 1.0724, adds to the upside filters.
Also, the Relative Strength Index (RSI) (14) has shifted into the bullish range of 60.00-80.00, which indicates that the upside momentum has been triggered.
Further correction to near May 30 high at 1.0746 would trigger a bargain buy opportunity, which will drive the asset towards June 02 high at 1.0779 followed by the round-level resistance at 1.0800.
In an alternate scenario, the downside move will resume if the shared currency pair drops below the June 05 low at 1.0675. This will drag the asset towards May 31 low at 1.0635 followed by March 03 low at 1.0588.
Technical Levels: Supports and Resistances
EURUSD currently trading at 1.0763 at the time of writing. Pair opened at 1.0782 and is trading with a change of -0.18 % .
| Overview | Overview.1 | |
|---|---|---|
| 0 | Today last price | 1.0763 |
| 1 | Today Daily Change | -0.0019 |
| 2 | Today Daily Change % | -0.1800 |
| 3 | Today daily open | 1.0782 |
The pair is trading below its 20 Daily moving average @ 1.0764, below its 50 Daily moving average @ 1.0887 , below its 100 Daily moving average @ 1.0809 and above its 200 Daily moving average @ 1.0516
| Trends | Trends.1 | |
|---|---|---|
| 0 | Daily SMA20 | 1.0764 |
| 1 | Daily SMA50 | 1.0887 |
| 2 | Daily SMA100 | 1.0809 |
| 3 | Daily SMA200 | 1.0516 |
The previous day high was 1.0787 while the previous day low was 1.0696. The daily 38.2% Fib levels comes at 1.0752, expected to provide support. Similarly, the daily 61.8% fib level is at 1.0731, expected to provide support.
Note the levels of interest below:
- Pivot support is noted at 1.0723, 1.0664, 1.0632
- Pivot resistance is noted at 1.0814, 1.0846, 1.0906
| Levels | Levels.1 |
|---|---|
| Previous Daily High | 1.0787 |
| Previous Daily Low | 1.0696 |
| Previous Weekly High | 1.0779 |
| Previous Weekly Low | 1.0635 |
| Previous Monthly High | 1.1092 |
| Previous Monthly Low | 1.0635 |
| Daily Fibonacci 38.2% | 1.0752 |
| Daily Fibonacci 61.8% | 1.0731 |
| Daily Pivot Point S1 | 1.0723 |
| Daily Pivot Point S2 | 1.0664 |
| Daily Pivot Point S3 | 1.0632 |
| Daily Pivot Point R1 | 1.0814 |
| Daily Pivot Point R2 | 1.0846 |
| Daily Pivot Point R3 | 1.0906 |
[/s2If]
Nehcap Expert Advisor
The NEHCAP MT4 EA is high quality professional trading system geared to generate returns without using GRID or martingales. Each trade has strict risk per trade parameter. The pairs under management include EURUSD, GBPUSD, AUDCAD, AUDNZD,GBPAUD, EURAUD, EURCAD, CHFJPY and many more.
The system is trading live: LIVE ACCOUNT TRACKING
You can run it free. Apply for a free trial and track our account. Buy the system or use profit share mechanism to generate returns on your MT4.
Join Our Telegram Group
")


