Oil consolidates as the upside is restricted due to weak global demand while the downside is being supported by OPEC’s production cuts. (Pivot Orderbook analysis)
…
This is a premium post.
[s2If !current_user_can(access_s2member_level4)]Please register for FREE REGISTER to read full post below containing analysis. In case of any error or you think you are not able to read the full post below, please email us at support#nehcap.com [lwa][/s2If] [s2If current_user_can(access_s2member_level1)]
- Oil consolidates as the upside is restricted due to weak global demand while the downside is being supported by OPEC’s production cuts.
- The black gold witnessed a nosedive move after a false and misleading report stating that US-Iran nuclear deal.
- Straight 200-period EMA indicates that the overall trend is non-directional.
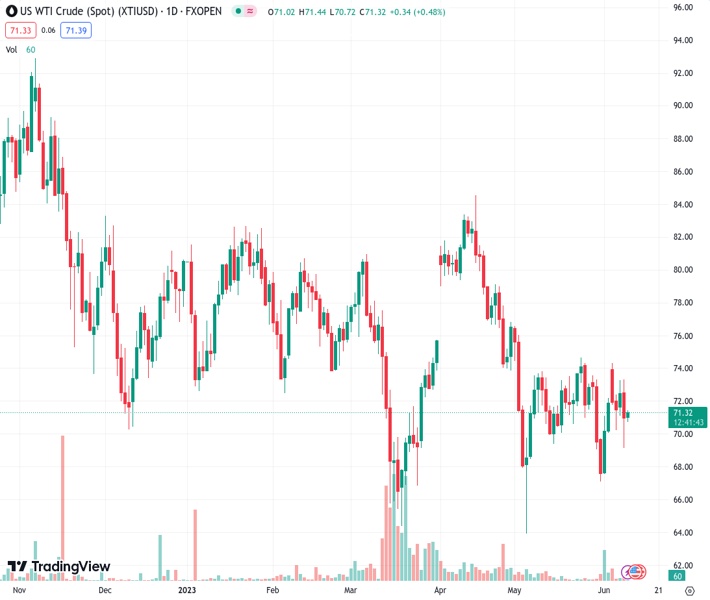
The pair currently trades last at 71.25.
The previous day high was 73.34 while the previous day low was 69.17. The daily 38.2% Fib levels comes at 70.76, expected to provide support. Similarly, the daily 61.8% fib level is at 71.75, expected to provide resistance.
West Texas Intermediate (WTI), futures on NYMEX, have turned sideways around $71.00 in the London session. The black gold is oscillating post a V-shape recovery from the crucial support of $69.00.
On Thursday, oil prices witnessed a nosedive move after a false and misleading report stating that the US-Iran nuclear deal that would let the Islamic Republic legally export some of its sanctioned oil was refuted by the White House, as reported by Reuters.
The oil price is expected to remain on tenterhooks as demand concerns China is demonstrating a bleak oil demand. The situation of deflation in China and producers’ inability of increasing the prices of goods and services at factory gates are evidence that overall demand in China is extremely weak.
Investors should note that China is the leading importer of oil in the world and weak Chinese demand put significant pressure on the oil price.
The oil price is consolidating in a range of $67.00-74.73 for more than one month. The upside in the oil price is restricted due to weak global demand while the downside is being supported by oil production cuts by OPEC.
A straight 200-period Exponential Moving Average (EMA) at $71.80 indicates that the overall trend is non-directional.
In addition to that, the Relative Strength Index (RSI) (14) is oscillating in the 40.00-60.00 range, indicating a lackluster performance.
A solid recovery above May 24 high at $74.70 will drive the asset toward April 28 high at $76.84. Further recovery above the latter would expose the oil price to April 26 high at $77.86.
In an alternate scenario, a downside move below May 31 low at $67.12 will drag the asset toward the $65.00 support followed by May’s low at $64.31.
Technical Levels: Supports and Resistances
XTIUSD currently trading at 71.25 at the time of writing. Pair opened at 71.06 and is trading with a change of 0.27 % .
| Overview | Overview.1 | |
|---|---|---|
| 0 | Today last price | 71.25 |
| 1 | Today Daily Change | 0.19 |
| 2 | Today Daily Change % | 0.27 |
| 3 | Today daily open | 71.06 |
The pair remains strongly bearish on the daily time frame. It trades below the 20 SMA @ 71.64, 50 SMA 74.75, 100 SMA @ 75.38 and 200 SMA @ 78.66.
| Trends | Trends.1 | |
|---|---|---|
| 0 | Daily SMA20 | 71.64 |
| 1 | Daily SMA50 | 74.75 |
| 2 | Daily SMA100 | 75.38 |
| 3 | Daily SMA200 | 78.66 |
The previous day high was 73.34 while the previous day low was 69.17. The daily 38.2% Fib levels comes at 70.76, expected to provide support. Similarly, the daily 61.8% fib level is at 71.75, expected to provide resistance.
Note the levels of interest below:
- Pivot support is noted at 69.04, 67.02, 64.87
- Pivot resistance is noted at 73.21, 75.36, 77.38
| Levels | Levels.1 |
|---|---|
| Previous Daily High | 73.34 |
| Previous Daily Low | 69.17 |
| Previous Weekly High | 73.58 |
| Previous Weekly Low | 67.12 |
| Previous Monthly High | 76.61 |
| Previous Monthly Low | 64.31 |
| Daily Fibonacci 38.2% | 70.76 |
| Daily Fibonacci 61.8% | 71.75 |
| Daily Pivot Point S1 | 69.04 |
| Daily Pivot Point S2 | 67.02 |
| Daily Pivot Point S3 | 64.87 |
| Daily Pivot Point R1 | 73.21 |
| Daily Pivot Point R2 | 75.36 |
| Daily Pivot Point R3 | 77.38 |
[/s2If]
Nehcap Expert Advisor
The NEHCAP MT4 EA is high quality professional trading system geared to generate returns without using GRID or martingales. Each trade has strict risk per trade parameter. The pairs under management include EURUSD, GBPUSD, AUDCAD, AUDNZD,GBPAUD, EURAUD, EURCAD, CHFJPY and many more.
The system is trading live: LIVE ACCOUNT TRACKING
You can run it free. Apply for a free trial and track our account. Buy the system or use profit share mechanism to generate returns on your MT4.
Join Our Telegram Group
")


