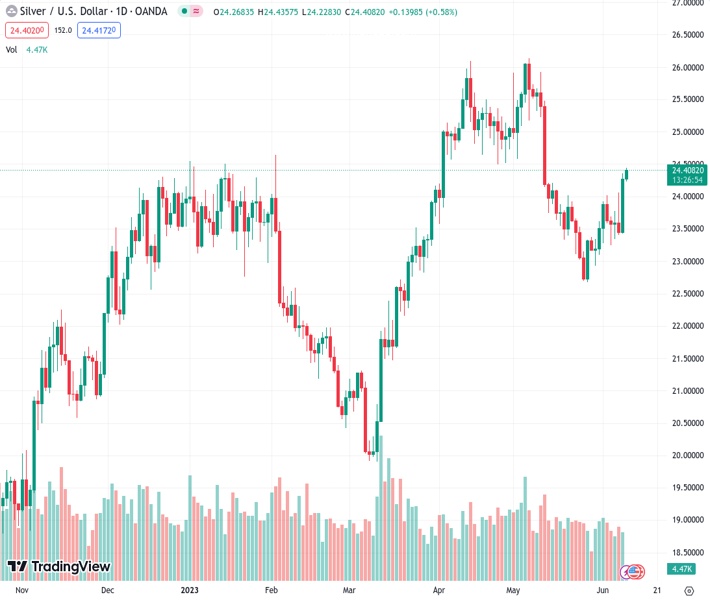
#XAGUSD @ 24.391 Silver scales higher for the second straight day and climbs to a near one-month high. (Pivot Orderbook analysis)
…
This is a premium post.
[s2If !current_user_can(access_s2member_level4)]Please register for FREE REGISTER to read full post below containing analysis. In case of any error or you think you are not able to read the full post below, please email us at support#nehcap.com [lwa][/s2If] [s2If current_user_can(access_s2member_level1)]
- Silver scales higher for the second straight day and climbs to a near one-month high.
- The overnight breakout through the $24.00 mark supports prospects for further gains.
- A sustained weakness below the $23.60-55 area is needed to negate the positive outlook.
The pair currently trades last at 24.391.
The previous day high was 24.36 while the previous day low was 23.43. The daily 38.2% Fib levels comes at 24.0, expected to provide support. Similarly, the daily 61.8% fib level is at 23.79, expected to provide support.
Silver builds on the previous day’s strong rally and gains some follow-through traction for the second successive day on Friday. The buying interest picks up pace during the early European session and lifts the white metal to a nearly one-month top, around the $24.40 region in the last hour.
Against the backdrop of the recent repeated failures to find acceptance below the 200-hour Simple Moving Average (SMA), the overnight sustained strength beyond the $24.00 mark was seen as a fresh trigger for bullish traders. The said handle coincides with the 38.2% Fibonacci retracement level of the downfall witnessed in May, from over a one-year peak, and should now act as a pivotal point for short-term traders.
Meanwhile, technical indicators on the daily chart have just started gaining positive traction and support prospects for a further near-term appreciating move. That said, Relative Strength Index (RSI) is flashing slightly overbought conditions on hourly charts and warrants some caution for bulls. This makes it prudent to wait for some intraday consolidation near the $24.45-$24.50 area, or the 50% Fibo. level before placing fresh bets.
Nevertheless, the XAG/USD now seems poised to surpass an intermediate hurdle near the $24.25-$24.30 region and aim to reclaim the $25.00 psychological mark. Some follow-through buying should pave the way for a further near-term appreciating move towards the next relevant hurdle is pegged near the $24.35-$24.40 region, above which the XAG/USD is likely to make a fresh attempt towards conquering the $26.00 mark.
On the flip side, the 38.2% Fibo. level, around the $24.00 round figure, now seems to protect the immediate downside. Any subsequent fall could be seen as a buying opportunity and remain limited near the $23.60-$23.55 confluence, comprising of the 200-period SMA on the 4-hour chart and the 23.6% Fibo. level. The said area should act as a strong base for the XAG/USD, which if broken will negate the positive outlook.
Technical Levels: Supports and Resistances
XAGUSD currently trading at 24.39 at the time of writing. Pair opened at 24.27 and is trading with a change of 0.49 % .
| Overview | Overview.1 | |
|---|---|---|
| 0 | Today last price | 24.39 |
| 1 | Today Daily Change | 0.12 |
| 2 | Today Daily Change % | 0.49 |
| 3 | Today daily open | 24.27 |
The pair is trading above its 20 Daily moving average @ 23.57, below its 50 Daily moving average @ 24.49 , above its 100 Daily moving average @ 23.35 and above its 200 Daily moving average @ 22.23
| Trends | Trends.1 | |
|---|---|---|
| 0 | Daily SMA20 | 23.57 |
| 1 | Daily SMA50 | 24.49 |
| 2 | Daily SMA100 | 23.35 |
| 3 | Daily SMA200 | 22.23 |
The previous day high was 24.36 while the previous day low was 23.43. The daily 38.2% Fib levels comes at 24.0, expected to provide support. Similarly, the daily 61.8% fib level is at 23.79, expected to provide support.
Note the levels of interest below:
- Pivot support is noted at 23.68, 23.09, 22.76
- Pivot resistance is noted at 24.61, 24.94, 25.53
| Levels | Levels.1 |
|---|---|
| Previous Daily High | 24.36 |
| Previous Daily Low | 23.43 |
| Previous Weekly High | 24.02 |
| Previous Weekly Low | 22.93 |
| Previous Monthly High | 26.14 |
| Previous Monthly Low | 22.68 |
| Daily Fibonacci 38.2% | 24.00 |
| Daily Fibonacci 61.8% | 23.79 |
| Daily Pivot Point S1 | 23.68 |
| Daily Pivot Point S2 | 23.09 |
| Daily Pivot Point S3 | 22.76 |
| Daily Pivot Point R1 | 24.61 |
| Daily Pivot Point R2 | 24.94 |
| Daily Pivot Point R3 | 25.53 |
[/s2If]
Nehcap Expert Advisor
The NEHCAP MT4 EA is high quality professional trading system geared to generate returns without using GRID or martingales. Each trade has strict risk per trade parameter. The pairs under management include EURUSD, GBPUSD, AUDCAD, AUDNZD,GBPAUD, EURAUD, EURCAD, CHFJPY and many more.
The system is trading live: LIVE ACCOUNT TRACKING
You can run it free. Apply for a free trial and track our account. Buy the system or use profit share mechanism to generate returns on your MT4.
Join Our Telegram Group
")


