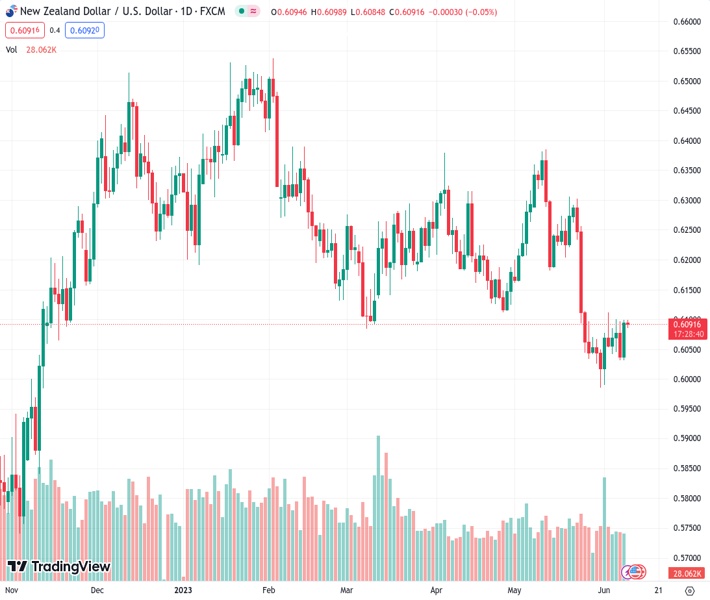
#NZDUSD @ 0.60916 ticks lower on the last day of the week and is pressured by a modest USD strength. (Pivot Orderbook analysis)
…
This is a premium post.
[s2If !current_user_can(access_s2member_level4)]Please register for FREE REGISTER to read full post below containing analysis. In case of any error or you think you are not able to read the full post below, please email us at support#nehcap.com [lwa][/s2If] [s2If current_user_can(access_s2member_level1)]
- NZD/USD ticks lower on the last day of the week and is pressured by a modest USD strength.
- Weaker Chinese inflation figures add to economic woes and benefit the safe-haven Greenback.
- The uncertainty over the Fed’s rate-hike path should cap the USD and lend support to the major.
The pair currently trades last at 0.60916.
The previous day high was 0.61 while the previous day low was 0.6026. The daily 38.2% Fib levels comes at 0.6072, expected to provide support. Similarly, the daily 61.8% fib level is at 0.6055, expected to provide support.
The NZD/USD pair struggles to capitalize on the previous day’s strong move up and edges lower during the Asian session on Friday. Spot prices currently trade just below the 0.6100 mark, though remain just a few pips below the weekly high.
The prevalent cautious mood around the equity markets, which, along with a modest uptick in the US Treasury bond yields, benefits the safe-haven US Dollar (USD) and undermines the risk-sensitive Kiwi. Weaker-than-expected Chinese inflation figures released earlier today add to worries about a global economic slowdown and tempers investors’ appetite for riskier assets. In fact, the National Bureau of Statistics reported that China’s headline CPI contracted by 0.2% in May and rose by 0.2% over the past 12 months.
Adding to this, China’s Producer Price Index (PPI) registered its worst decline since February 2016 and fell 4.6% YoY in May. This comes on the back of the recent dismal macro data from China and points to slowing post-COVID recovery in the world’s second-largest economy. The downside for the NZD/USD pair, however, remains cushioned as the USD bulls seem reluctant to place aggressive bets in the wake of firming expectations that the Federal Reserve (Fed) will skip raising interest rates at its June 13-14 meeting.
Against the backdrop of last week’s dovish rhetoric from several FOMC members, a rise in the US Initial Jobless Claims to a 20-month high last week lifts bets for an imminent pause in the US central bank’s rate-hiking cycle. The markets, however, are still pricing in the possibility of another 25 bps Fed rate hike in July. This could act as a tailwind for the Greenback ahead of next week’s release of the latest US consumer inflation figures and the key central bank event risk – the highly-anticipated FOMC monetary policy meeting.
In the meantime, the US bond yields will continue to play a key role in influencing the USD price dynamics and provide some impetus to the NZD/USD pair. Apart from this, the broader risk sentiment might contribute to producing short-term trading opportunities in the absence of any relevant market-moving economic data. Nevertheless, spot prices remain on track to post modest gains for the second straight week.
Technical Levels: Supports and Resistances
NZDUSD currently trading at 0.6091 at the time of writing. Pair opened at 0.6095 and is trading with a change of -0.07 % .
| Overview | Overview.1 | |
|---|---|---|
| 0 | Today last price | 0.6091 |
| 1 | Today Daily Change | -0.0004 |
| 2 | Today Daily Change % | -0.0700 |
| 3 | Today daily open | 0.6095 |
The pair remains strongly bearish on the daily time frame. It trades below the 20 SMA @ 0.6128, 50 SMA 0.6191, 100 SMA @ 0.6237 and 200 SMA @ 0.6149.
| Trends | Trends.1 | |
|---|---|---|
| 0 | Daily SMA20 | 0.6128 |
| 1 | Daily SMA50 | 0.6191 |
| 2 | Daily SMA100 | 0.6237 |
| 3 | Daily SMA200 | 0.6149 |
The previous day high was 0.61 while the previous day low was 0.6026. The daily 38.2% Fib levels comes at 0.6072, expected to provide support. Similarly, the daily 61.8% fib level is at 0.6055, expected to provide support.
Note the levels of interest below:
- Pivot support is noted at 0.6047, 0.6, 0.5973
- Pivot resistance is noted at 0.6122, 0.6148, 0.6196
| Levels | Levels.1 |
|---|---|
| Previous Daily High | 0.6100 |
| Previous Daily Low | 0.6026 |
| Previous Weekly High | 0.6112 |
| Previous Weekly Low | 0.5985 |
| Previous Monthly High | 0.6385 |
| Previous Monthly Low | 0.5985 |
| Daily Fibonacci 38.2% | 0.6072 |
| Daily Fibonacci 61.8% | 0.6055 |
| Daily Pivot Point S1 | 0.6047 |
| Daily Pivot Point S2 | 0.6000 |
| Daily Pivot Point S3 | 0.5973 |
| Daily Pivot Point R1 | 0.6122 |
| Daily Pivot Point R2 | 0.6148 |
| Daily Pivot Point R3 | 0.6196 |
[/s2If]
Nehcap Expert Advisor
The NEHCAP MT4 EA is high quality professional trading system geared to generate returns without using GRID or martingales. Each trade has strict risk per trade parameter. The pairs under management include EURUSD, GBPUSD, AUDCAD, AUDNZD,GBPAUD, EURAUD, EURCAD, CHFJPY and many more.
The system is trading live: LIVE ACCOUNT TRACKING
You can run it free. Apply for a free trial and track our account. Buy the system or use profit share mechanism to generate returns on your MT4.
Join Our Telegram Group
")


