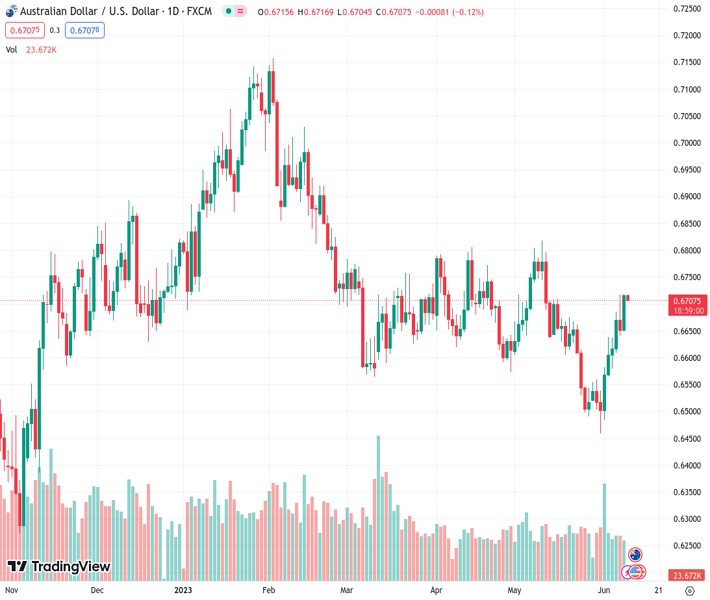
#AUDUSD @ 0.67071 pulls back from a four-week high touched on Friday, though lacks follow-through. (Pivot Orderbook analysis)
…
This is a premium post.
[s2If !current_user_can(access_s2member_level4)]Please register for FREE REGISTER to read full post below containing analysis. In case of any error or you think you are not able to read the full post below, please email us at support#nehcap.com [lwa][/s2If] [s2If current_user_can(access_s2member_level1)]
- AUD/USD pulls back from a four-week high touched on Friday, though lacks follow-through.
- Weaker than anticipated Chinese inflation figures for May exert some pressure on the Asusie.
- Bets for an imminent Fed rate hike pause continue to weigh on the USD and might lend support.
The pair currently trades last at 0.67071.
The previous day high was 0.6718 while the previous day low was 0.6652. The daily 38.2% Fib levels comes at 0.6693, expected to provide support. Similarly, the daily 61.8% fib level is at 0.6677, expected to provide support.
The AUD/USD pair edges lower during the Asian session on Friday and remains on the defensive following the release of the latest Chinese inflation figures. The pair is currently placed just above the 0.6700 round-figure mark and remains well within the striking distance of a four-week high touched the previous day.
The National Bureau of Statistics of China reported that the headline CPI fell more than expected, by 0.2% in May, and the yearly rate also fell short of consensus estimates, coming in at 0.3% during the reported month. Adding to this, the Producer Price Index (PPI) contracted further and fell by a 4.6% YoY rate in May as compared to the 3.6% decline reported in the previous month. The data adds to worries about a slowdown in the world’s second-largest economy and undermines the China-proxy Australian Dollar (AUD). Apart from this, a modest US Dollar (USD) uptick exerts some pressure on the AUD/USD pair.
The upside for the USD, meanwhile, seems limited in the wake of firming expectations that the Federal Reserve (Fed) will pause rate hikes next week. The bets were reaffirmed by Thursday’s disappointing release of the US Initial Jobless Claims data, which rose more than anticipated, to a 20-month high last week. The markets, however, are still pricing in the possibility of another 25 bps Fed rate hike in July. This, in turn, holds back traders from placing aggressive bearish bets and contributes to a mildly offered tone surrounding the AUD/USD pair against the backdrop of worries about a global economic slowdown.
It is worth recalling that the Organization for Economic Co-operation and Development (OECD) forecasts that the global economy is set for a weak recovery over the coming years as persistent core inflation and tighter monetary policy weigh on demand. OECD now expects the global economy to expand by 2.7% this year – the lowest annual rate of growth since the 2008-2009 financial crisis excluding the pandemic-hit year of 2020. This, in turn, keeps a lid on the optimism in the markets and should cap any meaningful upside for the risk-sensitive Aussie. Nevertheless, the AUD/USD pair remains on track to register strong gains for the second successive week as the focus shifts to the US CPI and the FOMC meeting next week.
Technical Levels: Supports and Resistances
AUDUSD currently trading at 0.6706 at the time of writing. Pair opened at 0.6716 and is trading with a change of -0.15 % .
| Overview | Overview.1 | |
|---|---|---|
| 0 | Today last price | 0.6706 |
| 1 | Today Daily Change | -0.0010 |
| 2 | Today Daily Change % | -0.1500 |
| 3 | Today daily open | 0.6716 |
The pair is trading above its 20 Daily moving average @ 0.6608, above its 50 Daily moving average @ 0.6662 , below its 100 Daily moving average @ 0.6743 and above its 200 Daily moving average @ 0.6691
| Trends | Trends.1 | |
|---|---|---|
| 0 | Daily SMA20 | 0.6608 |
| 1 | Daily SMA50 | 0.6662 |
| 2 | Daily SMA100 | 0.6743 |
| 3 | Daily SMA200 | 0.6691 |
The previous day high was 0.6718 while the previous day low was 0.6652. The daily 38.2% Fib levels comes at 0.6693, expected to provide support. Similarly, the daily 61.8% fib level is at 0.6677, expected to provide support.
Note the levels of interest below:
- Pivot support is noted at 0.6673, 0.6629, 0.6606
- Pivot resistance is noted at 0.6739, 0.6762, 0.6805
| Levels | Levels.1 |
|---|---|
| Previous Daily High | 0.6718 |
| Previous Daily Low | 0.6652 |
| Previous Weekly High | 0.6639 |
| Previous Weekly Low | 0.6458 |
| Previous Monthly High | 0.6818 |
| Previous Monthly Low | 0.6458 |
| Daily Fibonacci 38.2% | 0.6693 |
| Daily Fibonacci 61.8% | 0.6677 |
| Daily Pivot Point S1 | 0.6673 |
| Daily Pivot Point S2 | 0.6629 |
| Daily Pivot Point S3 | 0.6606 |
| Daily Pivot Point R1 | 0.6739 |
| Daily Pivot Point R2 | 0.6762 |
| Daily Pivot Point R3 | 0.6805 |
[/s2If]
Nehcap Expert Advisor
The NEHCAP MT4 EA is high quality professional trading system geared to generate returns without using GRID or martingales. Each trade has strict risk per trade parameter. The pairs under management include EURUSD, GBPUSD, AUDCAD, AUDNZD,GBPAUD, EURAUD, EURCAD, CHFJPY and many more.
The system is trading live: LIVE ACCOUNT TRACKING
You can run it free. Apply for a free trial and track our account. Buy the system or use profit share mechanism to generate returns on your MT4.
Join Our Telegram Group
")


