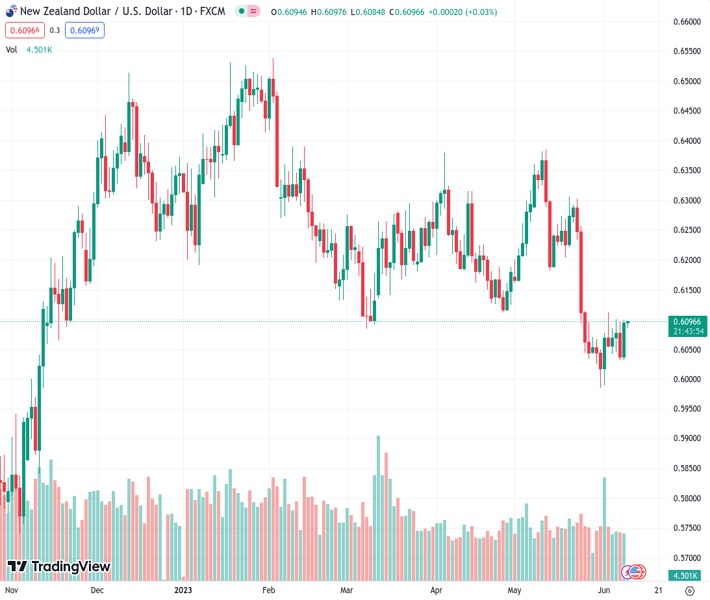
#NZDUSD @ 0.60930 approaches short-term key hurdle after rising the most in two months the previous day., @nehcap view: Further upside expected (Pivot Orderbook analysis)
…
This is a premium post.
[s2If !current_user_can(access_s2member_level4)]Please register for FREE REGISTER to read full post below containing analysis. In case of any error or you think you are not able to read the full post below, please email us at support#nehcap.com [lwa][/s2If] [s2If current_user_can(access_s2member_level1)]
- NZD/USD approaches short-term key hurdle after rising the most in two months the previous day.
- 12-day-old horizontal resistance zone, descending trend line from early May challenge Kiwi bulls before 200-SMA.
- Sellers may wait for weekly support break for fresh entry.
- China’s CPI, PPI for May can join upbeat RSI to favor bulls ahead of next week’s Fed meeting.
The pair currently trades last at 0.60930.
The previous day high was 0.6097 while the previous day low was 0.6031. The daily 38.2% Fib levels comes at 0.6056, expected to provide support. Similarly, the daily 61.8% fib level is at 0.6072, expected to provide support.
NZD/USD bulls are yet to retake control, despite the most in two months the previous day, as multiple key upside hurdles stand tall to challenge the latest advances ahead of the key China inflation data on early Friday. With this, the Kiwi pair dribbles around 0.6100 by the press time.
It should be noted that the quote’s sustained trading beyond the one-week-old ascending support line and upbeat RSI (14) line, not overbought, keeps the buyers hopeful.
However, a fortnight-long horizontal resistance area, which also comprises the 100-SMA hurdle, restricts the immediate upside of the NZD/USD pair around 0.6110-15.
Following that, a one-month-old descending trend line, close to 0.6135 by the press time, could challenge the Kiwi buyers ahead of directing them to the 200-SMA resistance of around 0.6180 at the latest.
In a case where the NZD/USD remains firmer past 0.6180, the odds of witnessing a rally beyond 0.6200 can’t be ruled out.
On the contrary, the aforementioned one-week-old rising trend line, near 0.6050 at the latest, restricts the immediate downside of the NZD/USD pair.
Even if the pair breaks the 0.6050 support, an area comprising multiple levels marked since May 26, surrounding .6025-30, can act as the last defense of the NZD/USD bulls.
Overall, the NZD/USD bulls are up for retaking control but they need validation from the 200-SMA and China’s inflation gauges for May, namely the Consumer Price Index (CPI) and Producer Price Index (PPI).
Trend: Further upside expected
Technical Levels: Supports and Resistances
NZDUSD currently trading at 0.6095 at the time of writing. Pair opened at 0.6037 and is trading with a change of 0.96% % .
| Overview | Overview.1 | |
|---|---|---|
| 0 | Today last price | 0.6095 |
| 1 | Today Daily Change | 0.0058 |
| 2 | Today Daily Change % | 0.96% |
| 3 | Today daily open | 0.6037 |
The pair remains strongly bearish on the daily time frame. It trades below the 20 SMA @ 0.6138, 50 SMA 0.6194, 100 SMA @ 0.624 and 200 SMA @ 0.6149.
| Trends | Trends.1 | |
|---|---|---|
| 0 | Daily SMA20 | 0.6138 |
| 1 | Daily SMA50 | 0.6194 |
| 2 | Daily SMA100 | 0.6240 |
| 3 | Daily SMA200 | 0.6149 |
The previous day high was 0.6097 while the previous day low was 0.6031. The daily 38.2% Fib levels comes at 0.6056, expected to provide support. Similarly, the daily 61.8% fib level is at 0.6072, expected to provide support.
Note the levels of interest below:
- Pivot support is noted at 0.6013, 0.5989, 0.5947
- Pivot resistance is noted at 0.6079, 0.6121, 0.6145
| Levels | Levels.1 |
|---|---|
| Previous Daily High | 0.6097 |
| Previous Daily Low | 0.6031 |
| Previous Weekly High | 0.6112 |
| Previous Weekly Low | 0.5985 |
| Previous Monthly High | 0.6385 |
| Previous Monthly Low | 0.5985 |
| Daily Fibonacci 38.2% | 0.6056 |
| Daily Fibonacci 61.8% | 0.6072 |
| Daily Pivot Point S1 | 0.6013 |
| Daily Pivot Point S2 | 0.5989 |
| Daily Pivot Point S3 | 0.5947 |
| Daily Pivot Point R1 | 0.6079 |
| Daily Pivot Point R2 | 0.6121 |
| Daily Pivot Point R3 | 0.6145 |
[/s2If]
Nehcap Expert Advisor
The NEHCAP MT4 EA is high quality professional trading system geared to generate returns without using GRID or martingales. Each trade has strict risk per trade parameter. The pairs under management include EURUSD, GBPUSD, AUDCAD, AUDNZD,GBPAUD, EURAUD, EURCAD, CHFJPY and many more.
The system is trading live: LIVE ACCOUNT TRACKING
You can run it free. Apply for a free trial and track our account. Buy the system or use profit share mechanism to generate returns on your MT4.
Join Our Telegram Group


