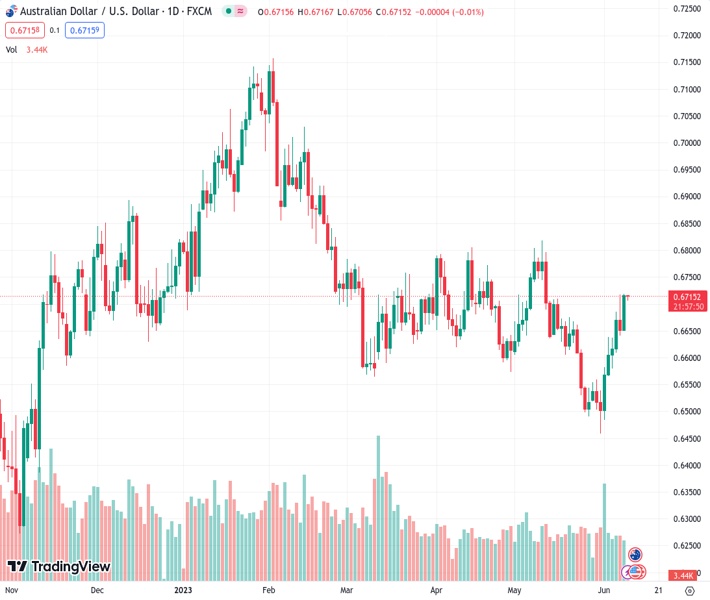
#AUDUSD @ 0.67159 seesaw around the highest levels in a month, rose the most in a week the previous day. (Pivot Orderbook analysis)
…
This is a premium post.
[s2If !current_user_can(access_s2member_level4)]Please register for FREE REGISTER to read full post below containing analysis. In case of any error or you think you are not able to read the full post below, please email us at support#nehcap.com [lwa][/s2If] [s2If current_user_can(access_s2member_level1)]
- AUD/USD seesaw around the highest levels in a month, rose the most in a week the previous day.
- US data keeps pushing back Fed hawks and weigh on the US Dollar.
- RBA’s hawkish surprise, optimism surrounding China supersede mixed Aussie data.
- China inflation numbers, risk catalysts can entertain traders ahead of a big week comprising FOMC.
The pair currently trades last at 0.67159.
The previous day high was 0.6717 while the previous day low was 0.6642. The daily 38.2% Fib levels comes at 0.6671, expected to provide support. Similarly, the daily 61.8% fib level is at 0.6688, expected to provide support.
AUD/USD bulls take a breather at the highest level in a month, after rising the most in one week, as they flirt with the 0.6715-20 zone amid the early hours of Friday’s Asian trading session. In doing so, the Aussie pair portrays a cautious mood ahead of inflation data from Australia’s key customer China while also cheering the latest prospects suggesting the monetary policy divergence between the Reserve Bank of Australia (RBA) and the US Federal Reserve (Fed).
With the US Initial Jobless Claims jumped to the highest levels since October 2021, the US Dollar Index (DXY) drowned on Thursday. That said, US Initial Jobless Claims rose to 261K in the week ended on June 02 versus 235K expected and 233K prior (revised). With this, the four-week average rose to 237.25K from 229.75K previous readings. Further, the Continuing Jobless Claims dropped to 1.757M in the week ended on May 26 from 1.794M prior (revised), compared to 1.8M market forecasts. Earlier in the week, the US ISM Services PMI, S&P Global PMIs and Factory Orders also printed downbeat outcomes and pushed back the Fed hawks while weighing on the US Dollar.
The same almost confirms no rate hike by the US Federal Reserve (Fed) interest rate hike in the next week’s Federal Open Market Committee (FOMC) monetary policy meeting while also cutting the market’s bets on July rate lifts and drowns the US Dollar.
On the other hand, the RBA policymakers remain hawkish and gained support from the International Monetary Fund’s (IMF) urge on Thursday to global central banks to “stay the course” on monetary policy and remain vigilant in combating inflation, per Reuters.
As a result, the RBA vs. Fed drama gains attention and supersede the unimpressive Aussie data to propel the AUD/USD price. Australia’s Trade Balance declines to 11,158M in April versus 14,000M market forecasts and 14,822M prior (revised). That said, the Pacific nation’s Exports dropped to -5.0%, versus 4.0% prior, whereas the Imports slid beneath 4.0% prior growth (revised) to 2.0% for the said month.
Elsewhere, multiple Chinese state banks including the Industrial and Commercial Bank of China, Bank of China and Construction Bank cut their benchmark rates. The same raises speculations that the Dragon Nation’s central bank, namely the People’s Bank of China (PBOC), will also cut the rates. Further, the fears of China’s market intervention also favored the AUD/USD bulls as PBoC Vice Governor said, “We have confidence, conditions and capacity to maintain stable operations of the FX market.” On the same line was Li Yunze, Director of China’s National Administration of Financial Regulation, who also made upbeat remarks on the Chinese economy as he said, “Economy still recovering,” while adding that demand will be boosted.
Against this backdrop, the US Treasury bond yields slumped while Wall Street benchmarks rose and exerted downside pressure on the greenback.
Looking forward, China’s inflation gauges for May, namely the Consumer Price Index (CPI) and Producer Price Index (PPI), will gain major attention amid the latest chatters of the PBoC rate cuts and the hawkish RBA. Should the inflation data arrive firmer the AUD/USD may renew the monthly high while downbeat outcomes can allow the bulls to retreat ahead of the next week’s Federal Open Market Committee (FOMC) monetary policy meeting.
Although the AUD/USD bulls are almost successful in piercing the four-month-old resistance line surrounding 0.6715, they need validation from the 100-DMA hurdle of around 0.6740 to challenge the previous monthly high of 0.6818.
Technical Levels: Supports and Resistances
AUDUSD currently trading at 0.6716 at the time of writing. Pair opened at 0.6652 and is trading with a change of 0.96% % .
| Overview | Overview.1 | |
|---|---|---|
| 0 | Today last price | 0.6716 |
| 1 | Today Daily Change | 0.0064 |
| 2 | Today Daily Change % | 0.96% |
| 3 | Today daily open | 0.6652 |
The pair is trading above its 20 Daily moving average @ 0.6607, above its 50 Daily moving average @ 0.6662 , below its 100 Daily moving average @ 0.6745 and above its 200 Daily moving average @ 0.6692
| Trends | Trends.1 | |
|---|---|---|
| 0 | Daily SMA20 | 0.6607 |
| 1 | Daily SMA50 | 0.6662 |
| 2 | Daily SMA100 | 0.6745 |
| 3 | Daily SMA200 | 0.6692 |
The previous day high was 0.6717 while the previous day low was 0.6642. The daily 38.2% Fib levels comes at 0.6671, expected to provide support. Similarly, the daily 61.8% fib level is at 0.6688, expected to provide support.
Note the levels of interest below:
- Pivot support is noted at 0.6623, 0.6595, 0.6548
- Pivot resistance is noted at 0.6699, 0.6746, 0.6775
| Levels | Levels.1 |
|---|---|
| Previous Daily High | 0.6717 |
| Previous Daily Low | 0.6642 |
| Previous Weekly High | 0.6639 |
| Previous Weekly Low | 0.6458 |
| Previous Monthly High | 0.6818 |
| Previous Monthly Low | 0.6458 |
| Daily Fibonacci 38.2% | 0.6671 |
| Daily Fibonacci 61.8% | 0.6688 |
| Daily Pivot Point S1 | 0.6623 |
| Daily Pivot Point S2 | 0.6595 |
| Daily Pivot Point S3 | 0.6548 |
| Daily Pivot Point R1 | 0.6699 |
| Daily Pivot Point R2 | 0.6746 |
| Daily Pivot Point R3 | 0.6775 |
[/s2If]
Nehcap Expert Advisor
The NEHCAP MT4 EA is high quality professional trading system geared to generate returns without using GRID or martingales. Each trade has strict risk per trade parameter. The pairs under management include EURUSD, GBPUSD, AUDCAD, AUDNZD,GBPAUD, EURAUD, EURCAD, CHFJPY and many more.
The system is trading live: LIVE ACCOUNT TRACKING
You can run it free. Apply for a free trial and track our account. Buy the system or use profit share mechanism to generate returns on your MT4.
Join Our Telegram Group


