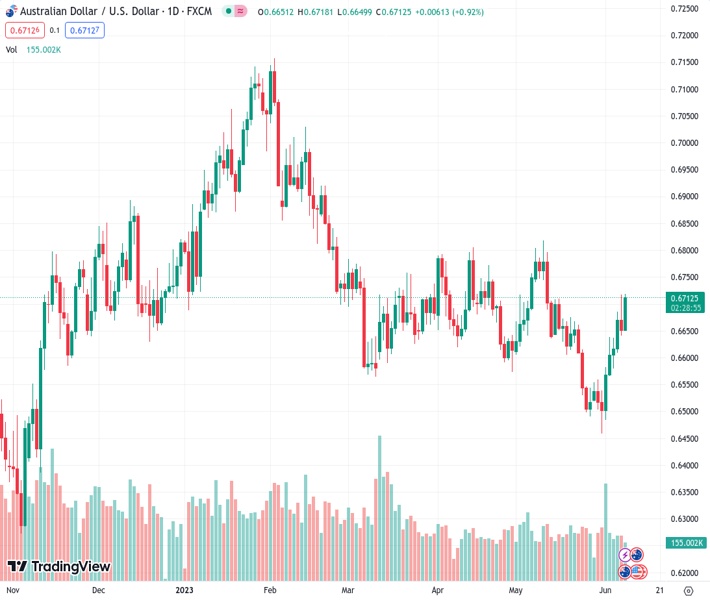
#AUDUSD @ 0.67120 gains 0.90% on Thursday following softer-than-expected US jobs data. (Pivot Orderbook analysis)
…
This is a premium post.
[s2If !current_user_can(access_s2member_level4)]Please register for FREE REGISTER to read full post below containing analysis. In case of any error or you think you are not able to read the full post below, please email us at support#nehcap.com [lwa][/s2If] [s2If current_user_can(access_s2member_level1)]
- AUD/USD gains 0.90% on Thursday following softer-than-expected US jobs data.
- US Dollar weakened as US Initial Jobless Claims jump to the highest since 2021
- Weak labor data softened hawkish bets on the Federal Reserve monetary policy.
The pair currently trades last at 0.67120.
The previous day high was 0.6717 while the previous day low was 0.6642. The daily 38.2% Fib levels comes at 0.6671, expected to provide support. Similarly, the daily 61.8% fib level is at 0.6688, expected to provide support.
The AUD/USD jumped to its highest level since May 11 at the 0.6715 area, gaining more than 90 pips on Thursday’s session. In that sense, US Initial Jobless Claims for the week that ended on June 2 accelerated to the highest in years, softening expectations of a hawkish Federal Reserve (Fed) ahead of next week’s interest rate decision.
The US labour market displayed signs of weakness as Initial Jobless Claims for the week ending on June 2 rose to 261K, surpassing market expectations of 235K and above the previous reading of 233K. Consequently, US bond yields experienced widespread declines, with the 2-year, 5-year, and 10-year rates exhibiting declines. This can be attributed to the revised expectations of a less aggressive Fed, resulting from the labour market’s display of weakness.
According to the CME FedWatch Tool, there is a higher likelihood 77% of the Fed not raising interest rates in their upcoming meeting, maintaining the target rate at 5.00%-5.25%.
On the other hand, the Aussie continues to benefit from the unexpected 25 basis point hike by the Reserve Bank of Australia (RBA) on Tuesday. Following the decision, RBA Governor Lowe emphasized on Wednesday that while preserving the achievements in the labour market is important, it does not imply that the board will tolerate a sustained increase in inflation restating the hawkish stances of the RBA. In that sense, the expectations of ongoing rate hikes support the Aussie’s gains.
According to the daily chart, the AUD/USD holds a short-term bullish outlook as the Relative Strength Index (RSI) and the Moving Average Convergence Divergence (MACD) suggest that buyers are in control while the pair now trades above the 20-, and 200-day Simple Moving Averages (SMA) en-route towards the 100-day SMA, which stands as strong resistance at 0.6752.
On the upside, the next resistance levels to watch are 0.6785 and 0.6800. In case of consolidating gains, immediate support levels are seen at the 200-day SMA at 0.6690 and the 20-day SMA at 0.6605.
Technical Levels: Supports and Resistances
AUDUSD currently trading at 0.6712 at the time of writing. Pair opened at 0.6652 and is trading with a change of 0.9 % .
| Overview | Overview.1 | |
|---|---|---|
| 0 | Today last price | 0.6712 |
| 1 | Today Daily Change | 0.0060 |
| 2 | Today Daily Change % | 0.9000 |
| 3 | Today daily open | 0.6652 |
The pair is trading above its 20 Daily moving average @ 0.6607, above its 50 Daily moving average @ 0.6662 , below its 100 Daily moving average @ 0.6745 and above its 200 Daily moving average @ 0.6692
| Trends | Trends.1 | |
|---|---|---|
| 0 | Daily SMA20 | 0.6607 |
| 1 | Daily SMA50 | 0.6662 |
| 2 | Daily SMA100 | 0.6745 |
| 3 | Daily SMA200 | 0.6692 |
The previous day high was 0.6717 while the previous day low was 0.6642. The daily 38.2% Fib levels comes at 0.6671, expected to provide support. Similarly, the daily 61.8% fib level is at 0.6688, expected to provide support.
Note the levels of interest below:
- Pivot support is noted at 0.6623, 0.6595, 0.6548
- Pivot resistance is noted at 0.6699, 0.6746, 0.6775
| Levels | Levels.1 |
|---|---|
| Previous Daily High | 0.6717 |
| Previous Daily Low | 0.6642 |
| Previous Weekly High | 0.6639 |
| Previous Weekly Low | 0.6458 |
| Previous Monthly High | 0.6818 |
| Previous Monthly Low | 0.6458 |
| Daily Fibonacci 38.2% | 0.6671 |
| Daily Fibonacci 61.8% | 0.6688 |
| Daily Pivot Point S1 | 0.6623 |
| Daily Pivot Point S2 | 0.6595 |
| Daily Pivot Point S3 | 0.6548 |
| Daily Pivot Point R1 | 0.6699 |
| Daily Pivot Point R2 | 0.6746 |
| Daily Pivot Point R3 | 0.6775 |
[/s2If]
Nehcap Expert Advisor
The NEHCAP MT4 EA is high quality professional trading system geared to generate returns without using GRID or martingales. Each trade has strict risk per trade parameter. The pairs under management include EURUSD, GBPUSD, AUDCAD, AUDNZD,GBPAUD, EURAUD, EURCAD, CHFJPY and many more.
The system is trading live: LIVE ACCOUNT TRACKING
You can run it free. Apply for a free trial and track our account. Buy the system or use profit share mechanism to generate returns on your MT4.
Join Our Telegram Group


